Enhanced Charts
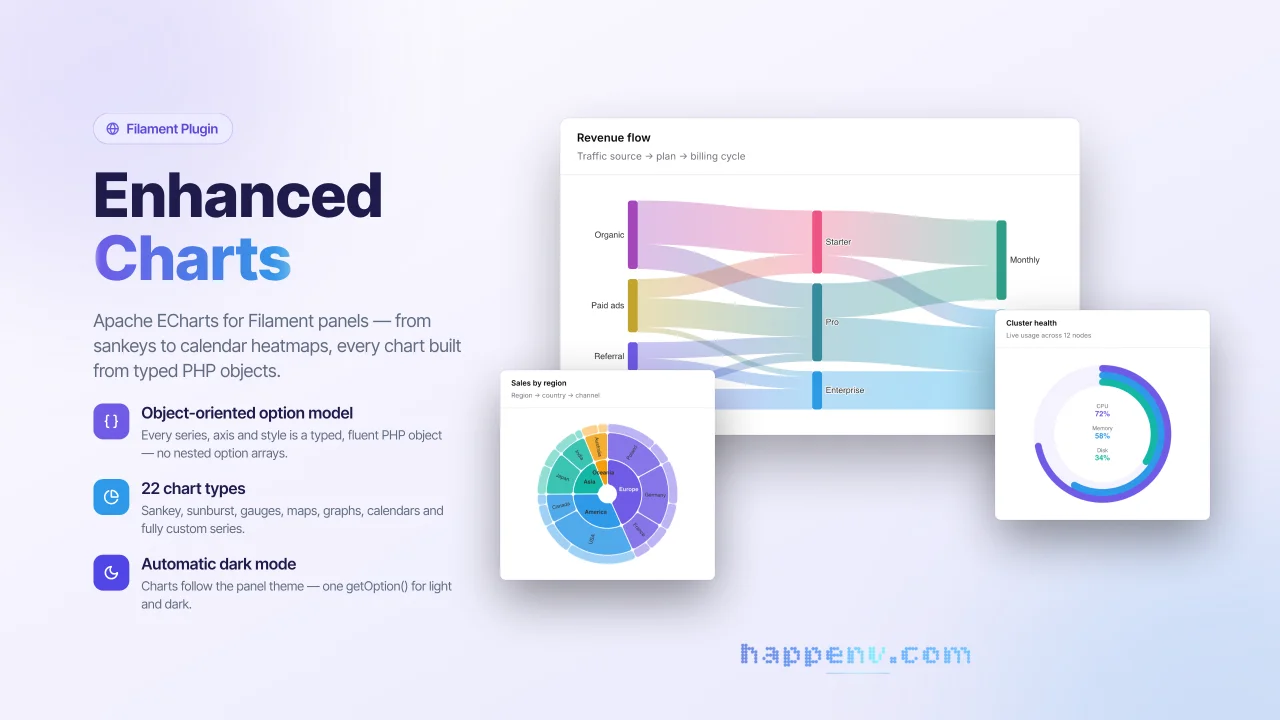
CommunityApache ECharts for Filament panels - from sankeys to calendar heatmaps, every chart built from typed PHP objects.
 Author:
Happenv sp. z o.o.
Author:
Happenv sp. z o.o.
Package health
BetaAutomated checks of this plugin's Composer package
15 checks
- Passed: GitHub Actions pinned to SHA
- Skipped: GitLab CI includes pinned to SHA
- Passed: Open security advisories
- Passed: Dependabot PR responsiveness — No open Dependabot PRs.
- Skipped: Renovate MR responsiveness
- Passed: Dependabot or Renovate configured
- Passed: Dependency update cooldown configured
- Passed: Provides a security policy
- Passed: Abandoned or archived — No consulted source marks the package abandoned (packagist, github).
- Passed: Commit and release recency — Active: last commit 0 days ago; last release 37 days ago.
-
Passed:
composer.lock not committed by library
—
composer.lockis absent from the released dist archive. - Passed: Dist archive is lean
-
Passed:
Current Laravel version supported
—
Package dependencies resolve together with current Laravel
13.0. -
Passed:
Current PHP version supported
—
Constraint
^8.4supports current PHP8.5. - Skipped: Current Symfony version supported
filament/
namespace. Review the source and install at your own risk. Found
malware or an unresolved security issue the author won't
address?
Report it
.
Documentation
- Key features
- Gallery
- Requirements
- Installation
- Configuration
- Usage
- Testing your application
- Translations
- Development
- Upgrading
- Changelog
- Contributing
- Security vulnerabilities
- Credits
- License
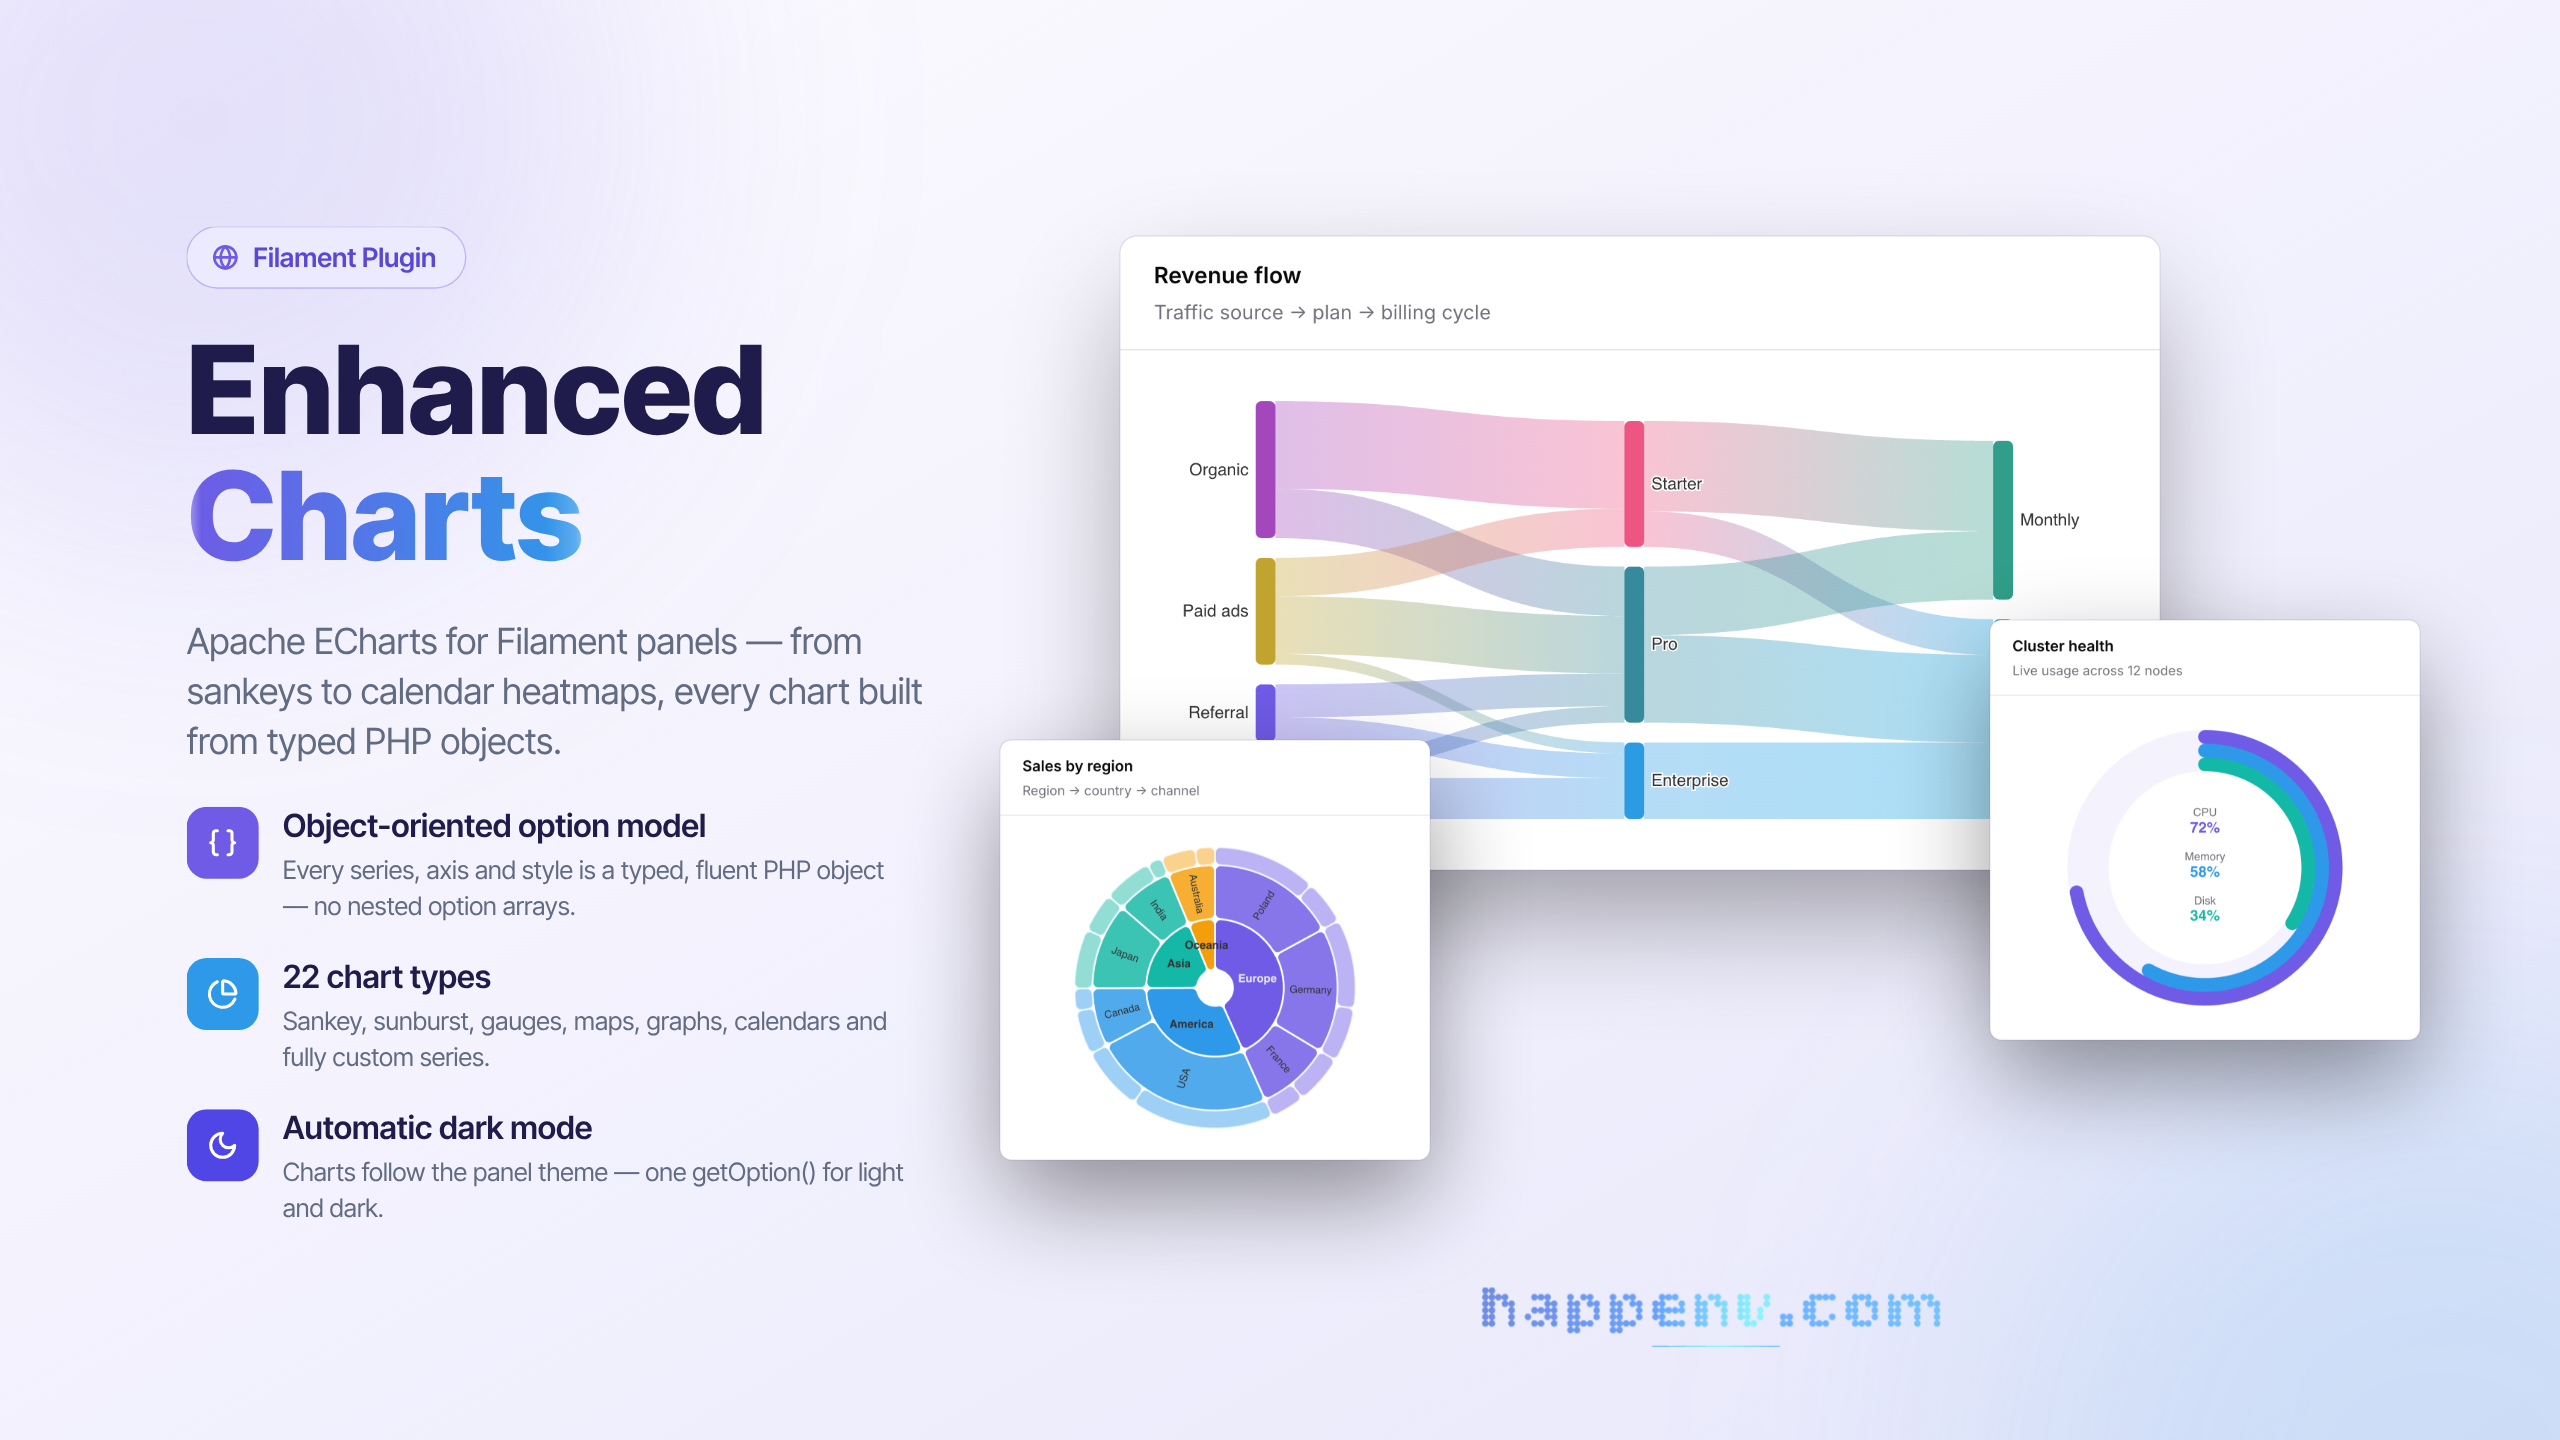






Apache ECharts integration for Filament: dashboard widgets and table columns driven by a fully typed, fluent PHP option model.
class OrdersChart extends EnhancedChartWidget
{
    protected static ?string $heading = 'Orders per day';

    protected function getOption(): Option
    {
        return Option::cartesian()
            ->xAxis(CategoryAxis::make()->data(['Mon', 'Tue', 'Wed']))
            ->series(LineSeries::make()->name('Orders')->smooth()->data([12, 20, 15]));
    }
}
#Key features
- Typed option model. The ECharts option tree is mirrored as fluent PHP builders — if you know an ECharts option, you know the method — and everything not (yet) modelled stays reachable through a
->raw()escape hatch on every node (The option model). - 23 series types. Line, bar, pie, scatter, effectScatter, candlestick, boxplot, heatmap, radar, gauge, funnel, sankey, chord, sunburst, treemap, tree, graph, parallel, themeRiver, pictorialBar, map, lines, and fully custom
renderItemseries. - Every coordinate system. Cartesian grids, polar, radar, geo/maps, calendar, singleAxis, parallel and matrix — plus datasets with transforms, visual maps, data zoom, toolbox, brush and graphic elements.
- Filament-native. Panel theming, automatic dark mode, Filament
Colorpalettes,RawJsfor client-side callbacks, Livewire polling, deferred loading and filters. - Data straight from Eloquent.
ChartData::fromPairs(),ChartData::fromTimeSeries()(laravel-trend compatible) andDataset::fromModels()turn query results into chart data, andHasChartDatabuilds a whole chart from data and a type (Feeding data from Eloquent). - 64 languages. Month and day names, toolbox and aria strings follow the app locale in every language Filament ships (Translations).
- Charts in table cells. Sparklines, candlesticks and donut pies inside table cells via
EnhancedChartColumn, or any custom per-record chart (Charts in table cells). - Testable. Livewire assertions for the resolved chart options in your application's tests (Testing your application), and the package itself is covered by a Pest suite on every supported version combination.
#Gallery
A taste of what the typed option model draws — every chart is a regular widget class, and follows your panel's light or dark mode automatically.
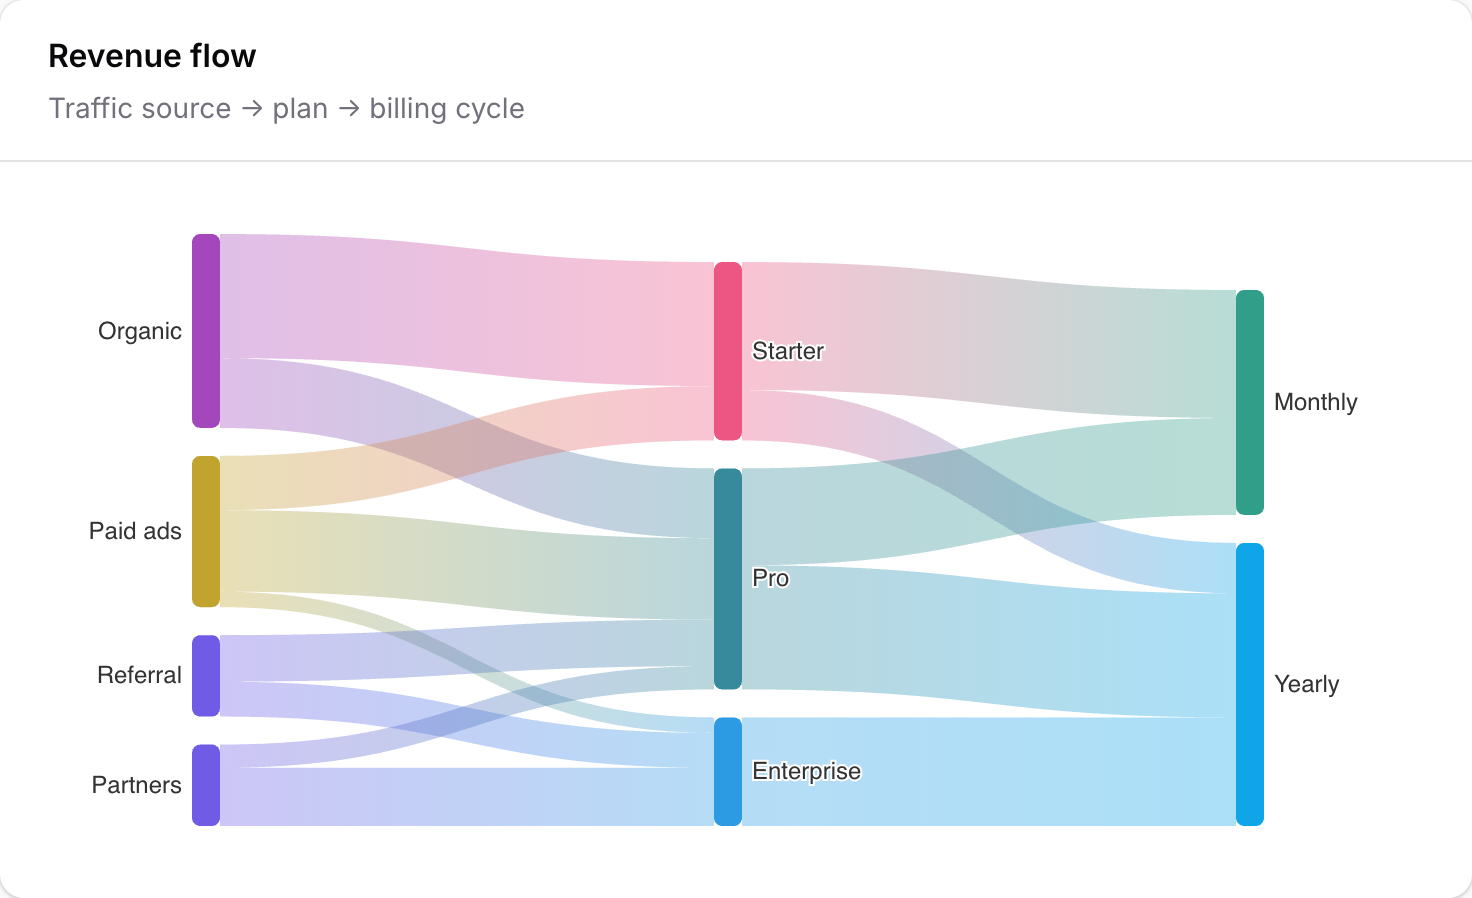 Sankey |
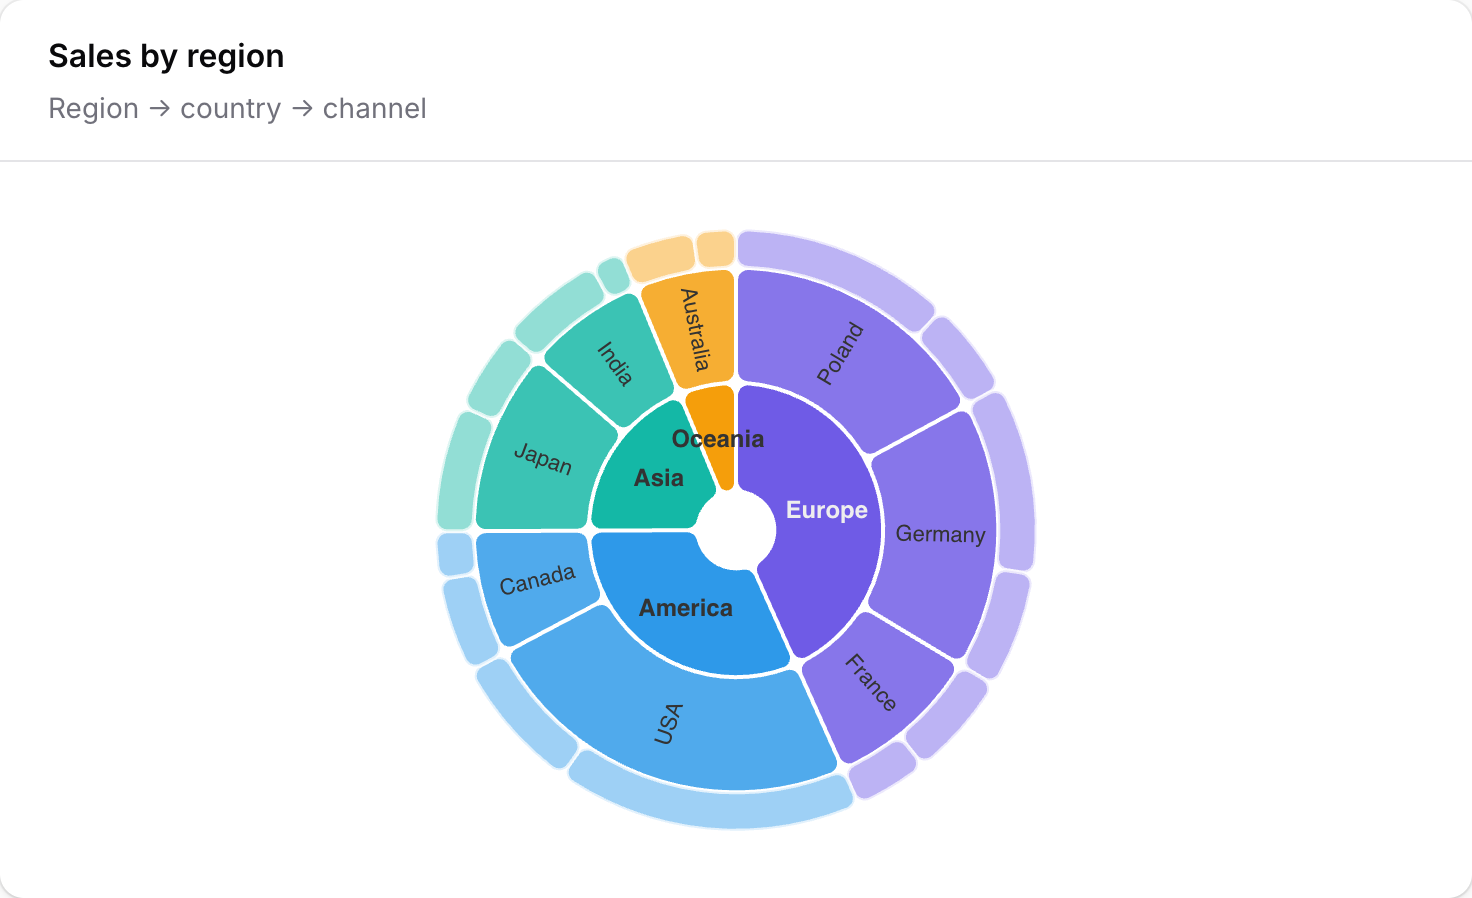 Sunburst |
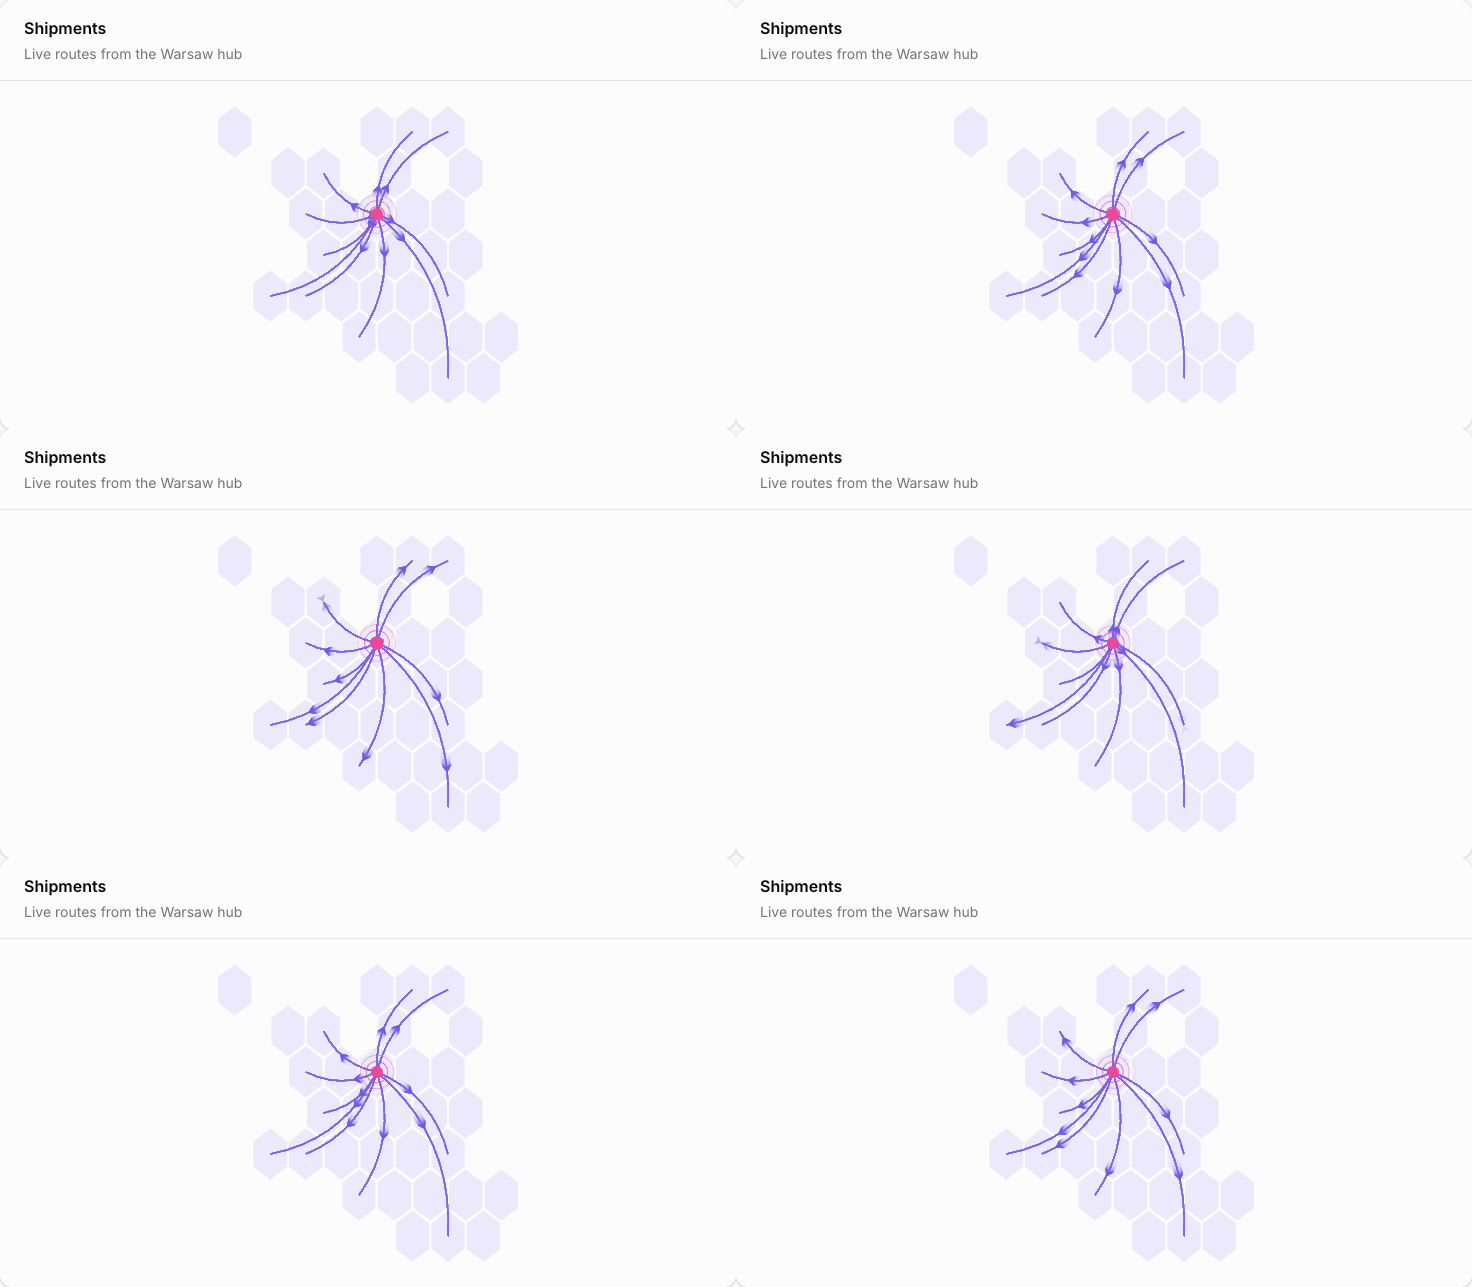 Animated routes |
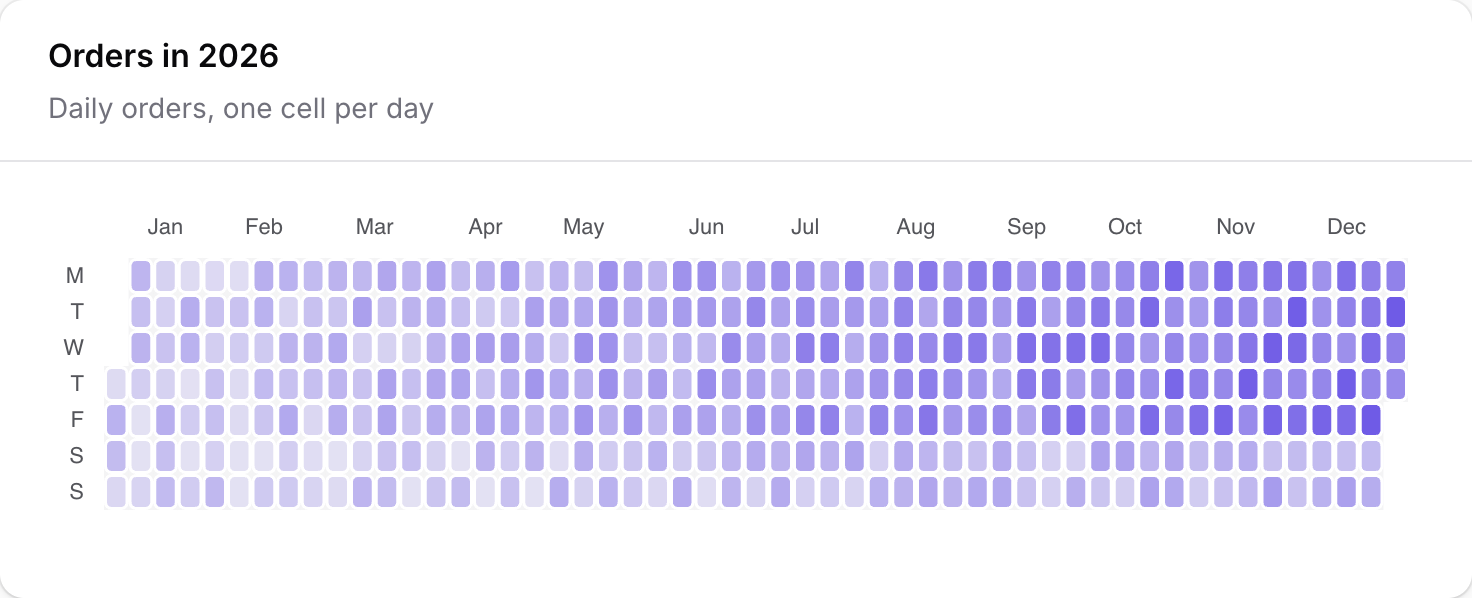 Calendar heatmap |
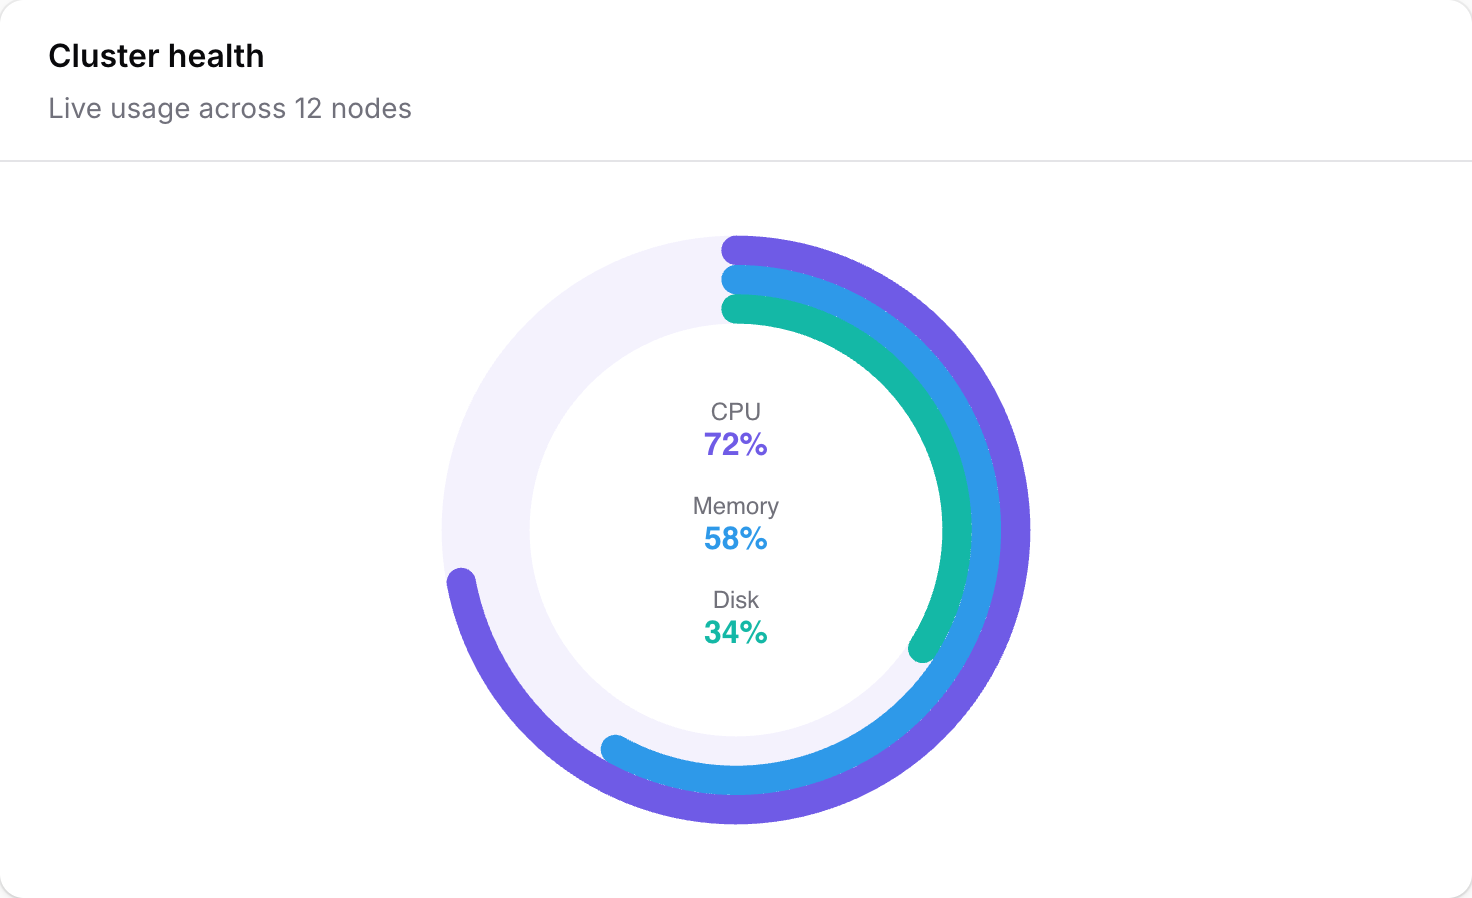 Progress rings |
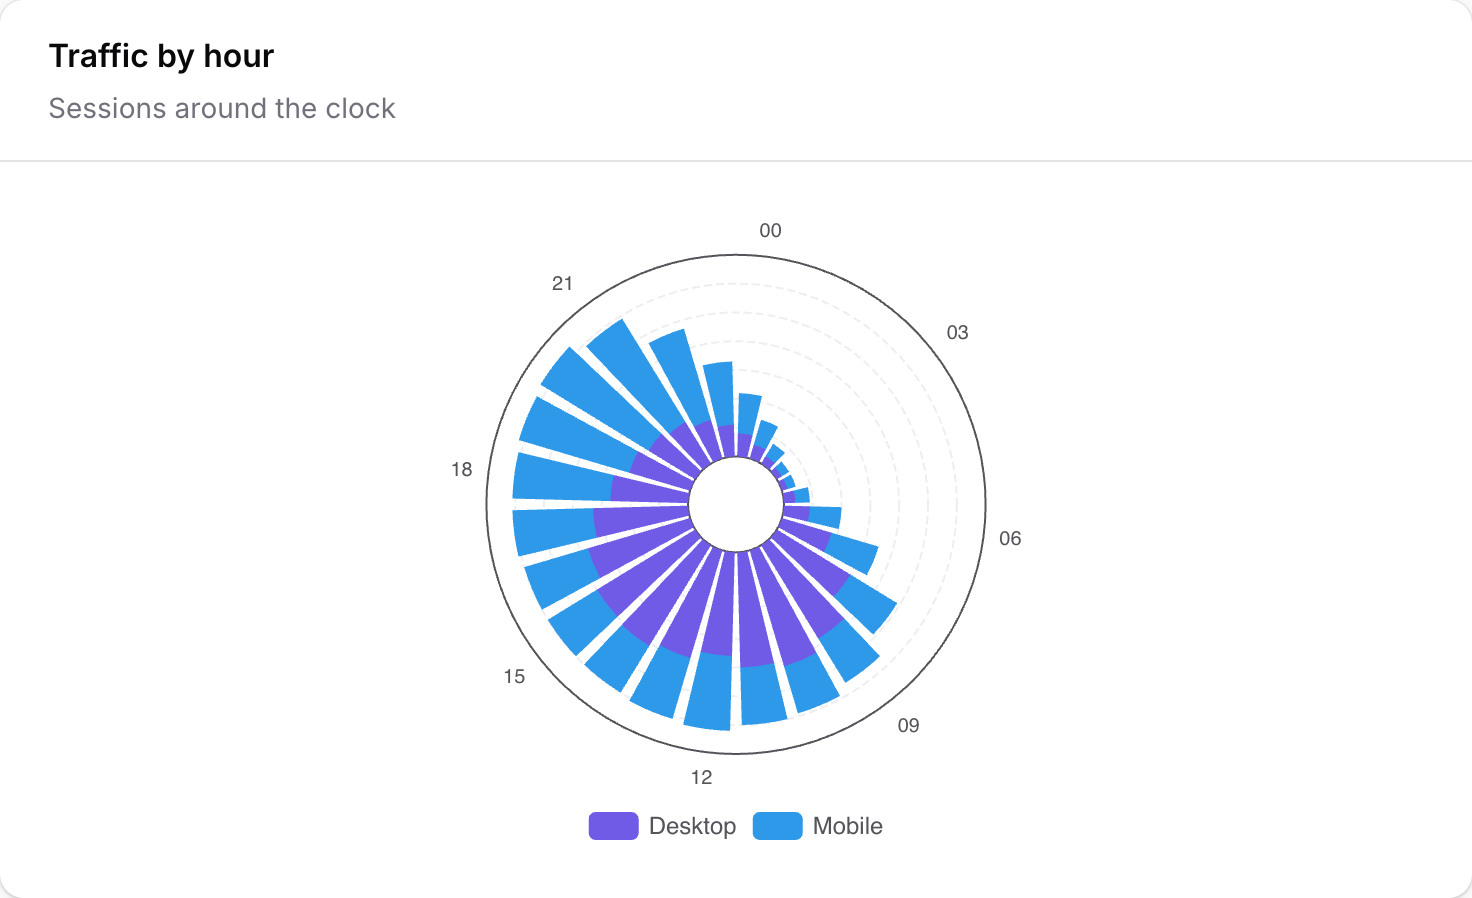 Polar bars |
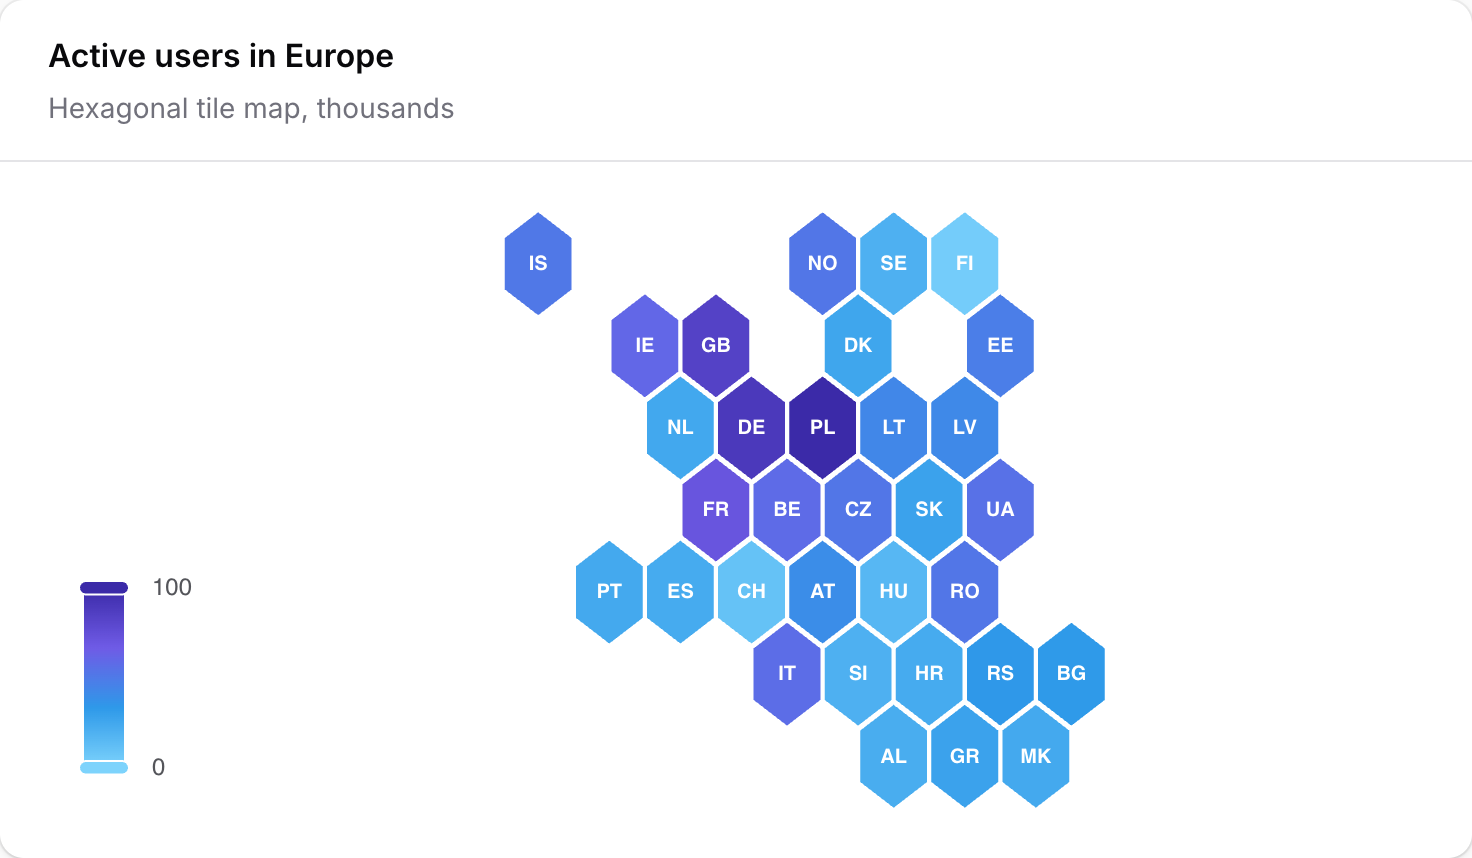 GeoJSON map |
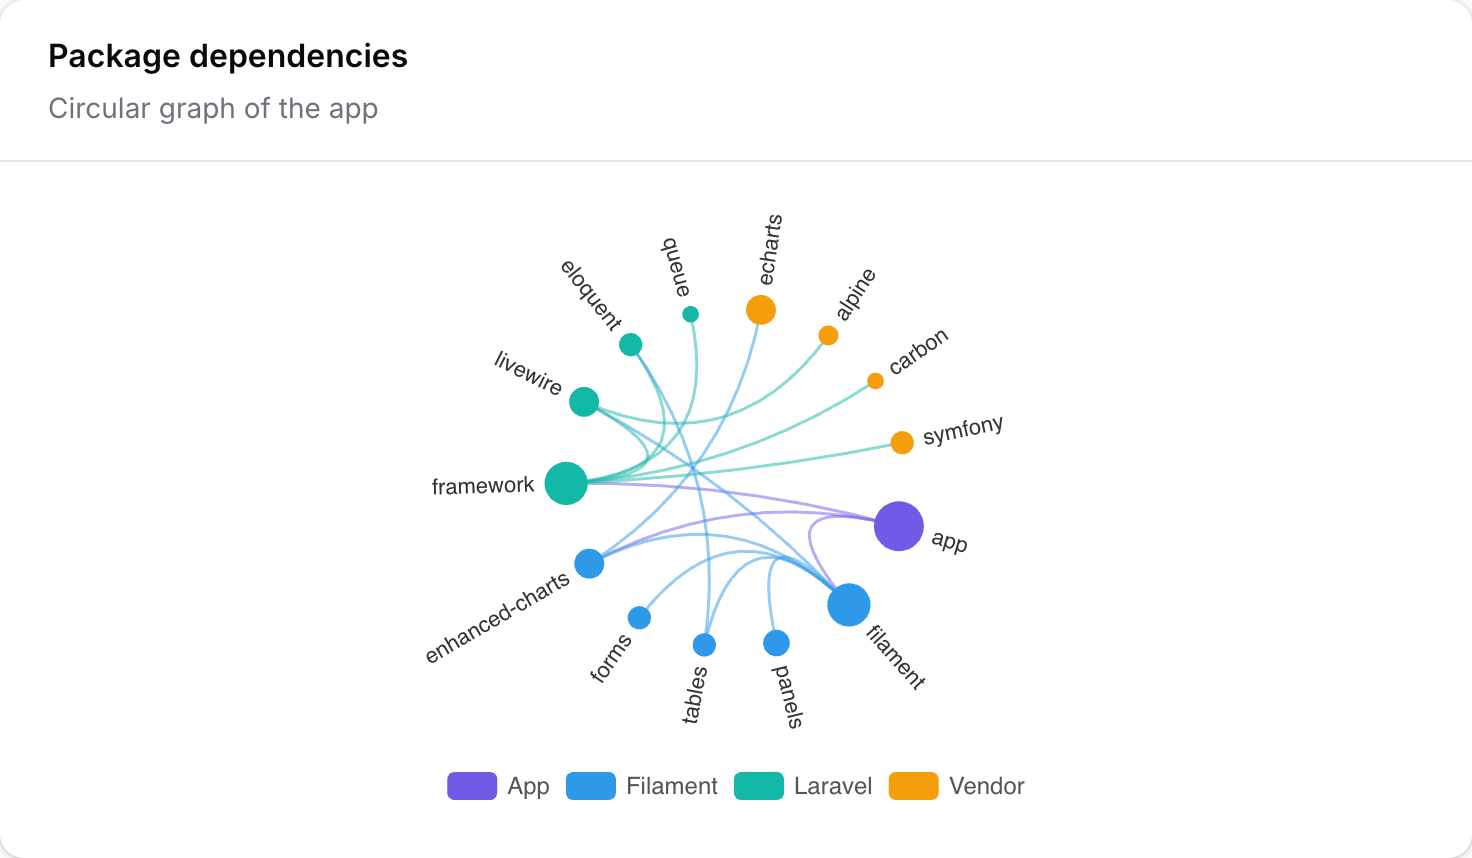 Graph |
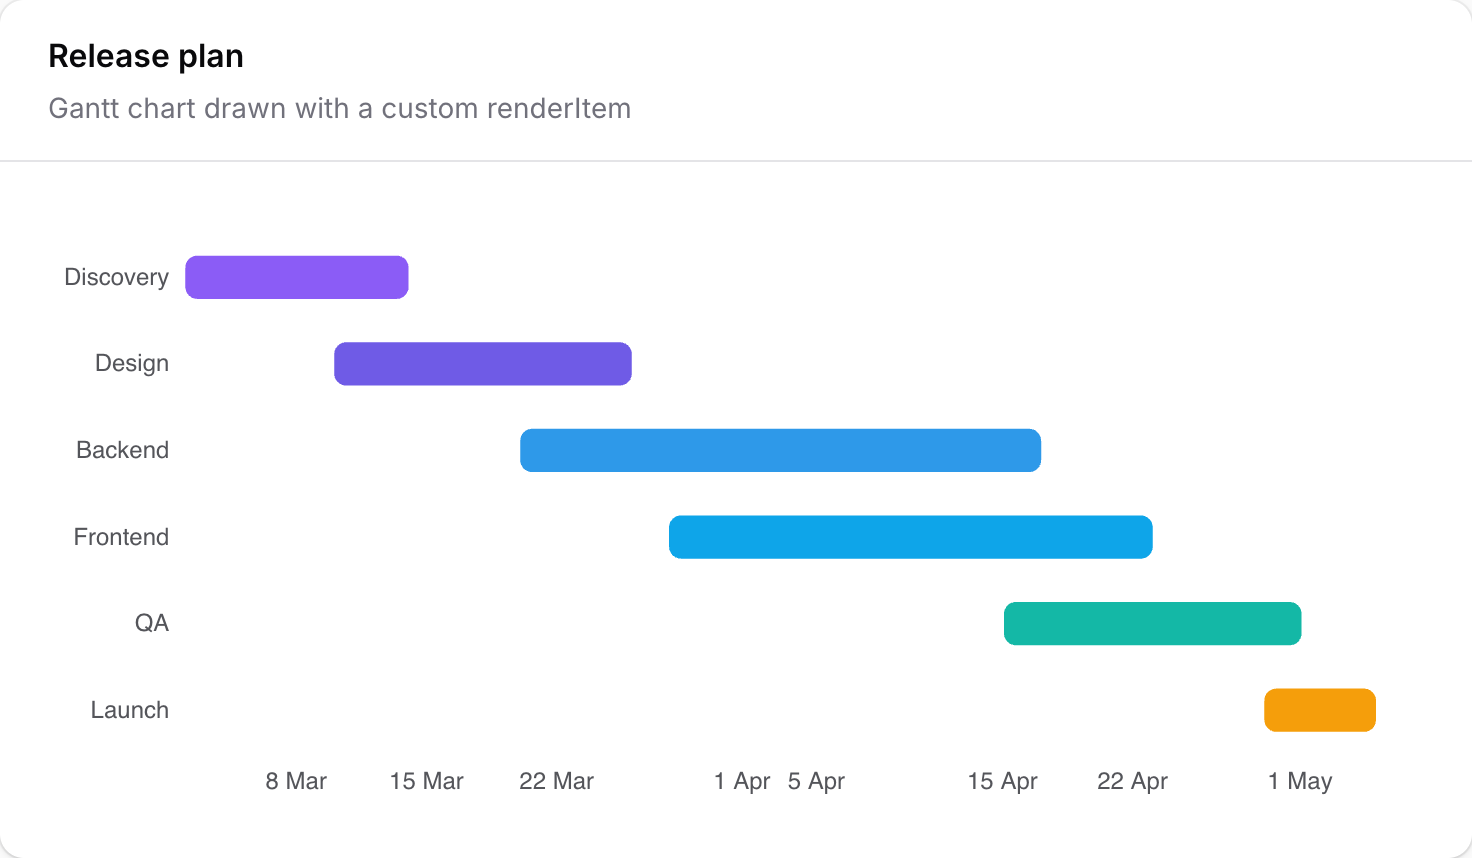 Custom Gantt |

#Requirements
| Package | Versions |
|---|---|
| PHP | 8.4 – 8.5 |
| Laravel | 12, 13 |
| Filament | 4, 5 |
#Installation
Install the package via Composer:
composer require happenv-com/filament-enhanced-charts
Register the plugin on each Filament panel that should render charts:
use Happenv\FilamentEnhancedCharts\FilamentEnhancedChartsPlugin;

public function panel(Panel $panel): Panel
{
    return $panel
        ->plugins([
            FilamentEnhancedChartsPlugin::make(),
        ]);
}
After installing or upgrading, republish the compiled JavaScript assets:
php artisan filament:assets
Upgrading from filament-echarts 2.x? See UPGRADING.md.
#Configuration
Publish the config file:
php artisan vendor:publish --tag="filament-enhanced-charts-config"
It lists the chart types the make:filament-enhanced-charts generator offers (see Generating a widget):
return [
    'chart_options' => [
        'Line', 'Bar', 'Pie', 'Scatter', 'Candlestick', 'Radar',
        'Boxplot', 'Sunburst', 'Parallel', 'Sankey', 'Funnel', 'Gauge',
    ],
];
Optionally, publish the views and translations:
php artisan vendor:publish --tag="filament-enhanced-charts-views"
php artisan vendor:publish --tag="filament-enhanced-charts-translations"
#Usage
#Generating a widget
The generator asks for the chart type, an optional resource and the panel, and writes a ready-to-edit widget from the matching stub:
php artisan make:filament-enhanced-charts BlogPostsChart
#Your first widget
A chart widget is a regular Filament widget: extend EnhancedChartWidget and return an Option from
getOption(). That is the whole story.
use Happenv\FilamentEnhancedCharts\Option\Axis\CategoryAxis;
use Happenv\FilamentEnhancedCharts\Option\Option;
use Happenv\FilamentEnhancedCharts\Option\Series\BarSeries;
use Happenv\FilamentEnhancedCharts\Option\Series\LineSeries;
use Happenv\FilamentEnhancedCharts\Widgets\EnhancedChartWidget;

class BlogPostsChart extends EnhancedChartWidget
{
    protected static ?string $heading = 'Blog posts';

    protected function getOption(): Option
    {
        return Option::cartesian()
            ->xAxis(CategoryAxis::make()->data(['Jan', 'Feb', 'Mar']))
            ->series(
                LineSeries::make()->name('Posts')->smooth()->data([10, 15, 8]),
                BarSeries::make()->name('Comments')->data([45, 60, 32]),
            );
    }
}
Two entry points exist on Option:
Option::make()— a blank slate.Option::cartesian()— a batteries-included preset for the common case: an axis-triggered tooltip and a top legend, ready for->xAxis()+->series().
When an x-axis is set and no y-axis is given, a ValueAxis is defaulted for you. Set
->yAxis(...) explicitly when you need something else (e.g. a CategoryAxis for a heatmap).
#The option model
Everything under Happenv\FilamentEnhancedCharts\Option\* is a fluent builder that serializes to the
exact ECharts option shape. This package deliberately
does not re-document every chart type — the ECharts docs and
examples gallery are the reference; the builders mirror
them method-for-method.
| Kind | Classes |
|---|---|
| Root | Option |
| Axes | Axis\CategoryAxis, Axis\ValueAxis, Axis\TimeAxis, Axis\LogAxis |
| Series | Series\LineSeries, BarSeries, PieSeries, ScatterSeries, EffectScatterSeries, CandlestickSeries, BoxplotSeries, HeatmapSeries, RadarSeries, GaugeSeries, FunnelSeries, SankeySeries, ChordSeries, SunburstSeries, TreemapSeries, TreeSeries, GraphSeries, ParallelSeries, ThemeRiverSeries, PictorialBarSeries, MapSeries, LinesSeries, CustomSeries |
| Components | Component\Legend, Tooltip, Title, Grid, DataZoom, VisualMap, Toolbox (+ Toolbox\* features), AxisPointer, Brush, Polar, AngleAxis, RadiusAxis, Radar, Geo, Calendar, SingleAxis, Parallel, ParallelAxis, Matrix, Dataset, Transform, Graphic (+ Graphic\* elements) |
| Styles | Style\ItemStyle, LineStyle, AreaStyle, Label, Emphasis |
| Marks | Mark\MarkLine, MarkPoint, MarkArea |
| Data | DataPoint, SankeyNode, SankeyLink |
Conventions that hold across the whole tree:
::make()+ fluent setters. Every builder is created with::make()and configured by chaining; setters return$this.- One or many. Slots that ECharts accepts as "an object or an array of objects" are variadic:
->grid(...),->xAxis(...),->title(...),->series(...),->visualMap(...), … Pass one or several; the emitted JSON follows ECharts' single-vs-array convention automatically. - Builders or arrays. Sub-config setters accept the matching builder or a plain array:
->itemStyle(ItemStyle::make()->borderRadius(4))and->itemStyle(['borderRadius' => 4])are equivalent. - Conditional building. All builders use Laravel's
Conditionable:->when($this->filter === 'year', fn (Option $o) => $o->dataZoom(...)). - Per-point configuration. Wherever a data item can be more than a value, pass a
DataPoint:DataPoint::make(1048)->name('Search')->itemStyle(ItemStyle::make()->color('#c23531')).
#The raw() escape hatch
Every node (Option, each series, axis, component, DataPoint, …) accepts
->raw(array $options). Raw options are deep-merged over the typed output, raw wins — so you
can reach any ECharts option the typed API doesn't model yet without abandoning the builders:
LineSeries::make()
    ->data($values)
    ->raw(['universalTransition' => true]);
To skip the typed model entirely, return a raw tree from a blank Option:
protected function getOption(): Option
{
    return Option::make()->raw([
        'xAxis' => ['type' => 'category', 'data' => ['A', 'B']],
        'series' => [['type' => 'bar', 'data' => [5, 7]]],
    ]);
}
Prefer the typed methods — raw() is the last resort, not the default.
#Formatters and JS callbacks
Strings passed to formatter()-style methods are treated as literal
ECharts templates and pass through
unchanged. For a real client-side function, pass Filament's RawJs: it is serialized as a marker
and revived into a genuine JS function in the browser.
use Filament\Support\RawJs;
use Happenv\FilamentEnhancedCharts\Option\Axis\ValueAxis;
use Happenv\FilamentEnhancedCharts\Option\Component\Tooltip;

Option::make()
    ->tooltip(Tooltip::make()->trigger('axis')->formatter('{b}: {c} pcs')) // template string
    ->yAxis(ValueAxis::make()->axisLabel(
        RawJs::make('(value) => (value / 1000) + "k"'),                    // executable JS
    ));
RawJs works anywhere in the tree — renderItem on a CustomSeries, symbolSize callbacks,
animationDelay functions, labelLayout, colors-by-callback, and so on. Inside these callbacks
the echarts global is available, so gallery snippets using echarts.format.addCommas(...) or
echarts.graphic.clipRectByRect(...) port verbatim.
#Numbers
Anywhere a number is accepted you may pass a native \BcMath\Number instead of
int|float|string; it is serialized as an exact numeric literal rather than a lossy float.
#Feeding data from Eloquent
A series' data() and an axis' data() take any iterable, so a Collection works — but the
shape matters:
-
A positional list (a bare
pluckor an array) → pass it straight todata(). Keys are dropped (the series/axis is positional), so a keyed Collection never mis-serializes to an object:$totals = Order::query()->orderBy('day')->pluck('total'); // [120, 90, 140, …] LineSeries::make()->data($totals); -
A keyed map where the key is the label (
pluck('total', 'channel'), agroupBycount) → useChartData::fromPairs()to split it into labels + values:use Happenv\FilamentEnhancedCharts\Data\ChartData; $data = ChartData::fromPairs(Order::query()->pluck('total', 'channel')); // ['B2B' => 60, …] Option::make() ->series(PieSeries::make()->data($data->toDataPoints())); // named slices // or, for a cartesian chart: Option::cartesian() ->xAxis(CategoryAxis::make()->data($data->labels())) ->series(BarSeries::make()->data($data->values())); -
Tabular rows for multiple series → build a
Datasetand let each seriesencode()its columns.Dataset::fromModels()projects a query result to just the chart columns (never the full attribute bag) — don't hand aCollection<Model>todata():Option::make() ->dataset(Dataset::fromModels( Order::query()->selectRaw('day, sum(total) total, channel')->get(), columns: ['day', 'total', 'channel'], )) ->series(LineSeries::make()->encode(x: 'day', y: 'total'));
#Time series
For "per day/week/month" aggregations, flowframe/laravel-trend
is the recommended companion: it handles the per-driver date bucketing (Postgres/MySQL/MariaDB/
SQLite) and gap-fills empty periods with zeros. It is an optional suggest — install it only if you
need time series:
composer require flowframe/laravel-trend
Feed its result straight to ChartData::fromTimeSeries():
use Flowframe\Trend\Trend;
use Happenv\FilamentEnhancedCharts\Data\ChartData;

$data = ChartData::fromTimeSeries(
    Trend::query($this->scopedOrders())
        ->between(now()->subDays(30), now())
        ->perDay()
        ->sum('total'),
);

Option::cartesian()
    ->xAxis(CategoryAxis::make()->data($data->labels()))
    ->series(LineSeries::make()->smooth()->data($data->values()));
ChartData::fromTimeSeries() reads date/aggregate off each row with data_get(), so it is
decoupled from the trend package — any Collection of rows carrying a label and a value column
works (pass labelKey:/valueKey: for different column names).
#Shortcut: a chart from just data + a type
When the chart is a single series of one of the common types, the HasChartData trait writes
getOption() for you — declare the data and (optionally) the type, nothing else:
use Happenv\FilamentEnhancedCharts\Concerns\HasChartData;
use Happenv\FilamentEnhancedCharts\Data\ChartData;
use Happenv\FilamentEnhancedCharts\Enums\ChartType;
use Happenv\FilamentEnhancedCharts\Widgets\EnhancedChartWidget;

class SalesByChannelChart extends EnhancedChartWidget
{
    use HasChartData;

    protected static ?string $heading = 'Sales by channel';

    protected function getData(): ChartData
    {
        return ChartData::fromPairs(Order::query()->pluck('total', 'channel'));
    }

    protected function chartType(): ChartType
    {
        return ChartType::Bar; // Line (default), Area, Bar, or Pie
    }
}
ChartType is a curated set — Line, Area, Bar, Pie — that maps cleanly onto the
labels + values (or, for pie, the named DataPoint) shape. The trait builds a cartesian option
(category x-axis + value y-axis) for the axis types and an axis-less option for pie. The moment you
want more — a second series, custom styling, marks, a scatter's x/y pairs — implement getOption()
directly with the typed builders; this trait is only the shallow-end shortcut.
#Colors
Color setters (color(), backgroundColor(), borderColor(), shadowColor(), …) accept:
- any CSS color string (
'#7c3aed','rgb(124, 58, 237)'), - an ECharts gradient/pattern array,
- a Filament palette —
Color::Amberresolves to its 500 shade, and Filament'soklch(...)values are converted torgb()so ECharts can both paint them and derive hover shades:
use Filament\Support\Colors\Color;

BarSeries::make()
    ->color(Color::Emerald)          // 500 shade
    ->data($values);

LineSeries::make()
    ->color(Color::Amber[600])       // an explicit shade
    ->data($values);
#Dark mode
Dark mode is automatic. Charts render transparent over the Filament card, and when the panel is in dark mode the package overlays a theme layer client-side — axis lines/labels, split lines, legend, title, tooltip, visual maps, parallel axes and outside series labels are all lightened for readability. The theme reapplies live when the user toggles light/dark. You write the option once; both modes just work.
Tip: skip forced backgroundColor and hardcoded text colors in your options — inherit the card
and let the theme adapt.
#Page scrolling
By default the mouse wheel scrolls the page, not the chart: inside data zoom stops
wheel-zooming (drag-to-pan is kept) and any roam is downgraded to drag-pan. That way a dashboard
full of charts never traps the user's scroll.
Opt a chart back into wheel-zoom (e.g. a full-bleed map) on the widget:
protected static bool $scrollable = false;
or per option, which wins over the widget default:
Option::make()->scrollable(false);
#Widget configuration
protected static ?string $heading = 'Revenue';        // or override getHeading()
protected static ?string $subheading = 'Last 30 days'; // or getSubheading()
protected static bool $isCollapsible = true;           // or isCollapsible()
protected static int $contentHeight = 400;             // px, default 300; or getContentHeight()
protected static ?string $footer = 'Updated hourly';   // or getFooter() (string|Htmlable|View)
protected static string $chartId = 'revenueChart';     // stable DOM id, optional
protected static string $renderer = 'canvas';          // or 'svg'; or getRenderer()
protected int | string | array $columnSpan = 'full';
The header disappears entirely when no heading, subheading or filters are set.
#Deferred loading
Don't hold up the page for a slow query:
protected static bool $deferLoading = true;

protected function getOption(): Option
{
    if (! $this->readyToLoad) {
        return Option::make();
    }

    return Option::cartesian()->series(/* the expensive part */);
}
#Loading indicator
protected static ?string $loadingIndicator = 'Loading…'; // or getLoadingIndicator() returning a View
#Live updating (polling)
Widgets poll every 5 seconds by default. Change or disable it with an instance property:
protected ?string $pollingInterval = '10s';

protected ?string $pollingInterval = null; // disable
Updates are diffed server-side — the chart only re-renders when the resolved options actually changed.
#Filtering chart data
#Single select
Return options from getFilters() and read the active value from $this->filter:
public ?string $filter = 'month';

protected function getFilters(): ?array
{
    return [
        'week' => 'Last week',
        'month' => 'Last month',
        'year' => 'This year',
    ];
}

protected function getOption(): Option
{
    $data = match ($this->filter) {
        'week' => $this->weekly(),
        'month' => $this->monthly(),
        'year' => $this->yearly(),
    };

    return Option::cartesian()->series(LineSeries::make()->data($data));
}
A select appears in the widget header and the chart updates live on change.
#Filter schema
For a richer filter form, implement the package's HasFiltersSchema contract and use
Filament's chart-widget filters trait; filter values arrive in $this->filters:
use Filament\Forms\Components\DatePicker;
use Filament\Schemas\Schema;
use Filament\Widgets\ChartWidget\Concerns\HasFiltersSchema;
use Happenv\FilamentEnhancedCharts\Contracts\HasFiltersSchema as HasFiltersSchemaContract;
use Happenv\FilamentEnhancedCharts\Widgets\EnhancedChartWidget;

class BlogPostsChart extends EnhancedChartWidget implements HasFiltersSchemaContract
{
    use HasFiltersSchema;

    public function filtersSchema(Schema $schema): Schema
    {
        return $schema->components([
            DatePicker::make('date_start')->default(now()->subMonth()),
            DatePicker::make('date_end')->default(now()),
        ]);
    }

    public function updatedInteractsWithSchemas(string $statePath): void
    {
        parent::updatedInteractsWithSchemas($statePath);

        $this->updateOptions();
    }

    protected function getOption(): Option
    {
        $start = $this->filters['date_start'] ?? null;
        $end = $this->filters['date_end'] ?? null;

        // ...
    }
}
Implementing the contract is what makes the filter dropdown render — don't skip it.
#Maps (GeoJSON)
A MapSeries or geo component needs its map registered client-side. Return name => url pairs
from getMaps(); each is fetched and passed to echarts.registerMap() before first paint:
use Happenv\FilamentEnhancedCharts\Option\Component\VisualMap;
use Happenv\FilamentEnhancedCharts\Option\Series\MapSeries;

/** @return array<string, string> */
public function getMaps(): array
{
    return ['world' => asset('geo/world.json')];
}

protected function getOption(): Option
{
    return Option::make()
        ->visualMap(VisualMap::continuous()->min(0)->max(100)->calculable())
        ->series(MapSeries::make()->map('world')->roam()->data($rows));
}
#Charts in table cells
EnhancedChartColumn renders a small chart per row. Three presets cover the common cases; chart()
takes over for anything else. Return null/empty data to render nothing for that row.
use Happenv\FilamentEnhancedCharts\Columns\EnhancedChartColumn;

EnhancedChartColumn::make('trend')
    ->sparkline(fn (Product $record): array => $record->daily_sales)
    ->fill(),                                      // area fill; ->bars() for bar sparklines

EnhancedChartColumn::make('ohlc')
    ->width(160)                                   // px, '100%', or a Closure; height(int) too
    ->candles(fn (Product $record): array => $record->ohlc_rows), // [open, close, low, high] rows

EnhancedChartColumn::make('mix')
    ->pie(fn (Order $record): array => ['B2B' => 60, 'B2C' => 40]), // donut

EnhancedChartColumn::make('custom')
    ->chart(fn (Server $record): ?Option => Option::make()
        ->series(GaugeSeries::make()->data([DataPoint::make($record->cpu)]))),
Cell charts ship with a sensible baseline (tooltip escaping the cell, no legend, tight margins)
and are disposed cleanly as rows leave the DOM. ->renderer('svg') is available per column.
Custom ->chart() closures can start from the same baseline via
EnhancedChartColumn::cellOption() (optionally passing the tooltip trigger, e.g. 'axis').
#Testing your application
The package registers a Livewire Testable mixin with chart assertions for your app's tests:
use function Pest\Livewire\livewire;

livewire(RevenueChart::class)
    ->assertChartSeriesCount(2)
    ->assertChartHasSeries('line')
    ->assertChartOptions(fn (array $options): bool => $options['series'][0]['smooth'] === true);
RawJs and BcMath\Number values appear in the resolved options as ['__js__' => '…'] markers — see UPGRADING.md.
#Translations
Charts speak your app's locale. Month and day names on time axes and calendars, the toolbox, legend selector and the screen-reader (aria) description all follow app()->getLocale() — in every language Filament ships:
am ar az bg bn bs ca ckb cs da de el en es et eu fa fi fil fr he hi hr hu hy id it ja ka km ko ku lt lus lv mk mn ms my nb ne nl pl pt pt_BR ro ru sk sl sq sr_Cyrl sr_Latn sv sw tg th tr uk ur uz vi zh_CN zh_HK zh_TW
Each language is an ECharts locale object in resources/lang/{locale}/locale.php. Where ECharts has its own translation it is used as is (npm run locales regenerates those files); for the others the month and day names come from CLDR and the rest is translated in the package. A missing key falls back to English.
Publish the files to change a string or add a language:
php artisan vendor:publish --tag="filament-enhanced-charts-translations"
#Development
composer test          # the test suite
composer phpstan       # static analysis
composer cs            # fix code style: composer normalize, Rector, Pint
composer ci            # everything CI checks, locally
The package's JavaScript is built by bin/build.js into resources/dist, which is committed. After changing resources/js, rebuild and commit the result — CI refuses outdated assets:
npm ci
npm run build   # or `npm run dev` to rebuild on change
npm run lint    # Prettier check, as in CI
#Upgrading
Breaking changes and how to migrate are described in UPGRADING for every major version.
#Changelog
See CHANGELOG and GitHub releases for what has changed recently.
#Contributing
See CONTRIBUTING for details.
#Security vulnerabilities
Please review our security policy on how to report security vulnerabilities.
#Credits
- Happenv sp. z o.o.
- webard
- elemind
- Strongly inspired by Leandro Ferreira's Apex Charts plugin
- All contributors
#License
The MIT License (MIT). See License File for more information.
The author
Happenv is a software development company specializing in e-commerce solutions, logistics systems, and Order Management Systems (OMS). We design, build, and maintain scalable business applications that help companies streamline operations, automate workflows, and improve customer experiences. Our expertise includes custom development, system integrations, and long-term support of solutions built with Laravel and Filament, delivering reliable and efficient platforms tailored to modern commerce and logistics needs.
From the same author
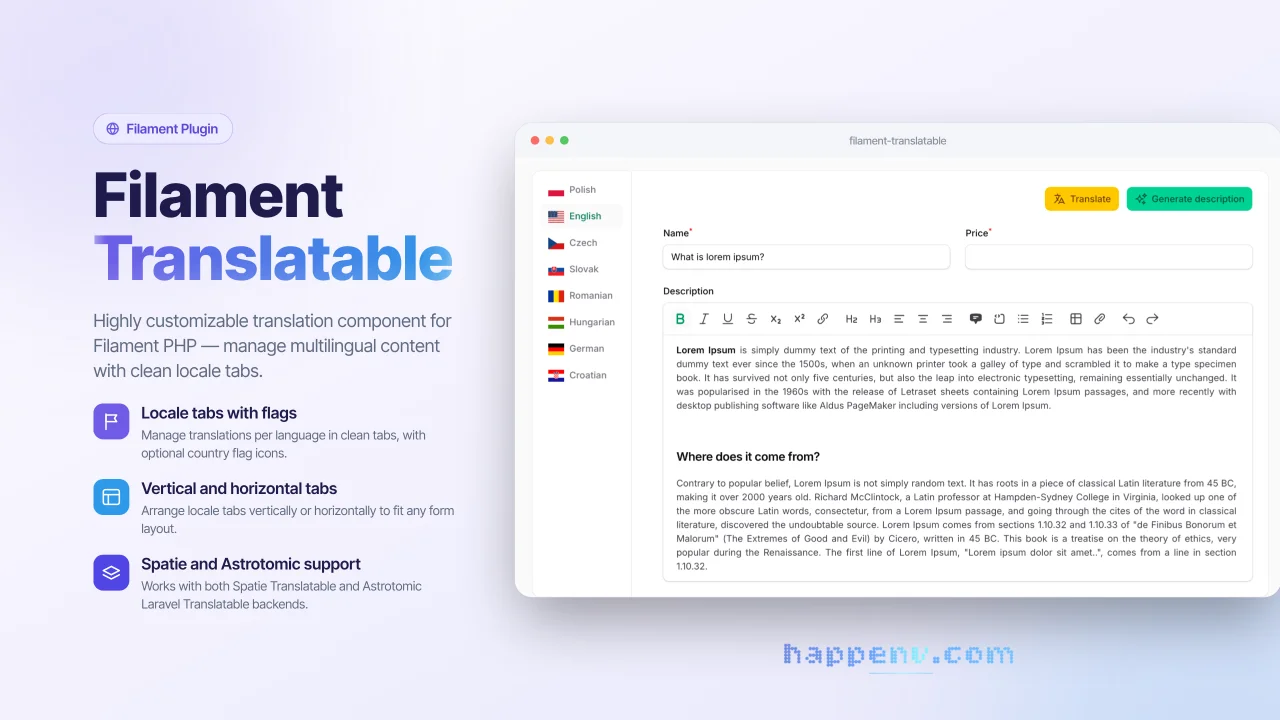
Translatable Fields
ilament Translatable is a flexible package that provides a complete solution for managing multilingual content in Filament admin panels. It allows you to easily create translatable form fields with an intuitive tabbed interface, supporting multiple locales and translation packages.
Author:
Happenv sp. z o.o.
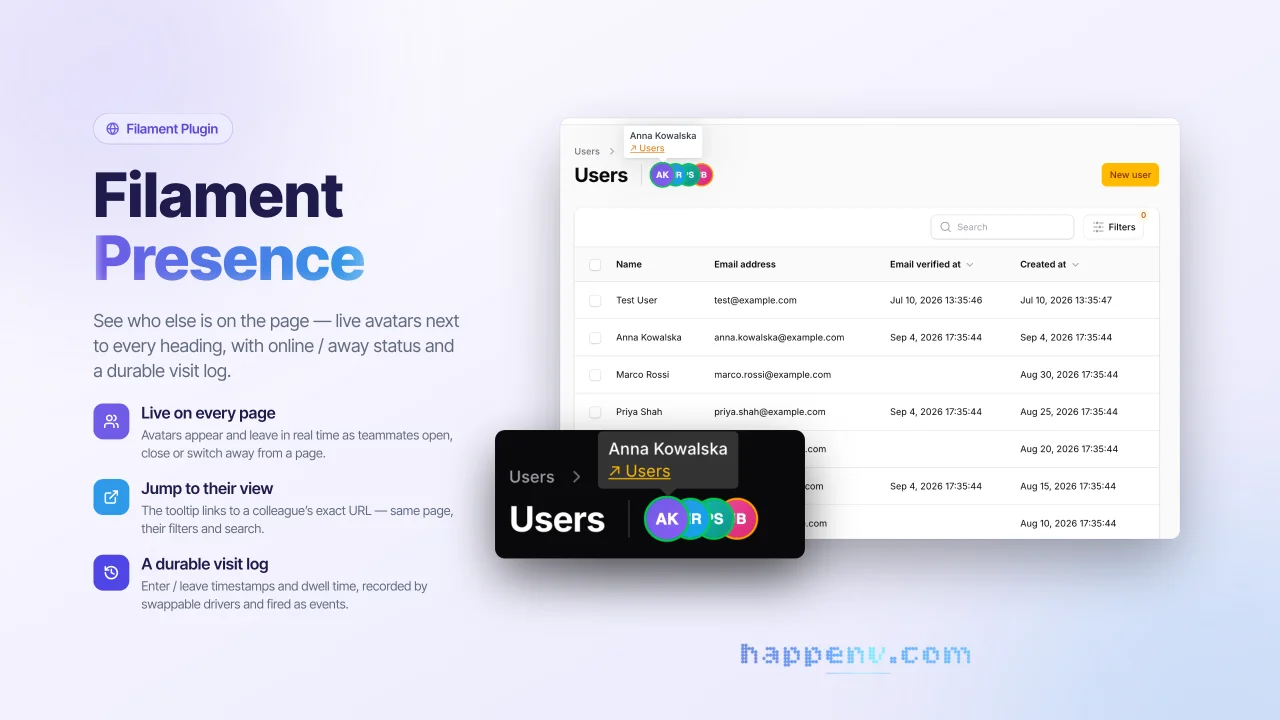
User Presence
See who else is on the page - live avatars next to every heading, with online / away status and a durable visit log.
Author:
Happenv sp. z o.o.
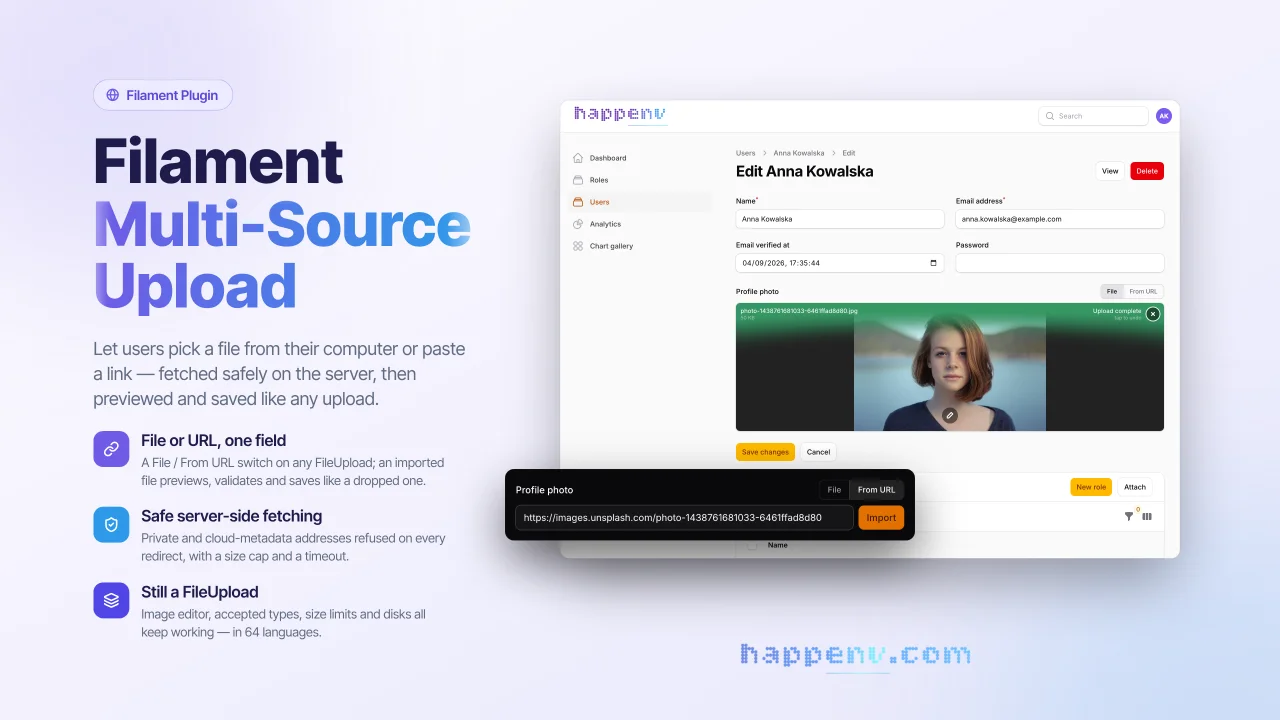
Multi Source Upload
A drop-in replacement for Filament's FileUpload field that lets users add a file from their disk or from a URL.
Author:
Happenv sp. z o.o.
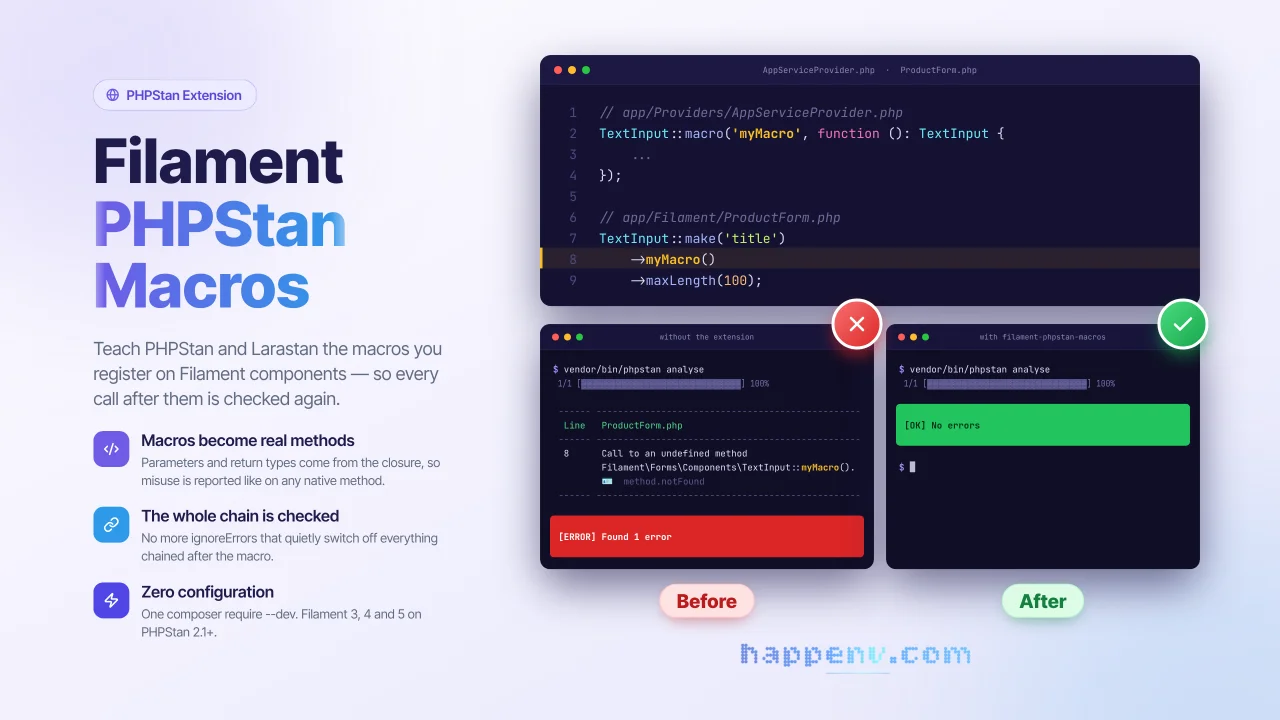
PHPStan readable macros
PHPStan and Larastan understand macros registered on Filament components.
Author:
Happenv sp. z o.o.
Featured Plugins
A selection of plugins curated by the Filament team
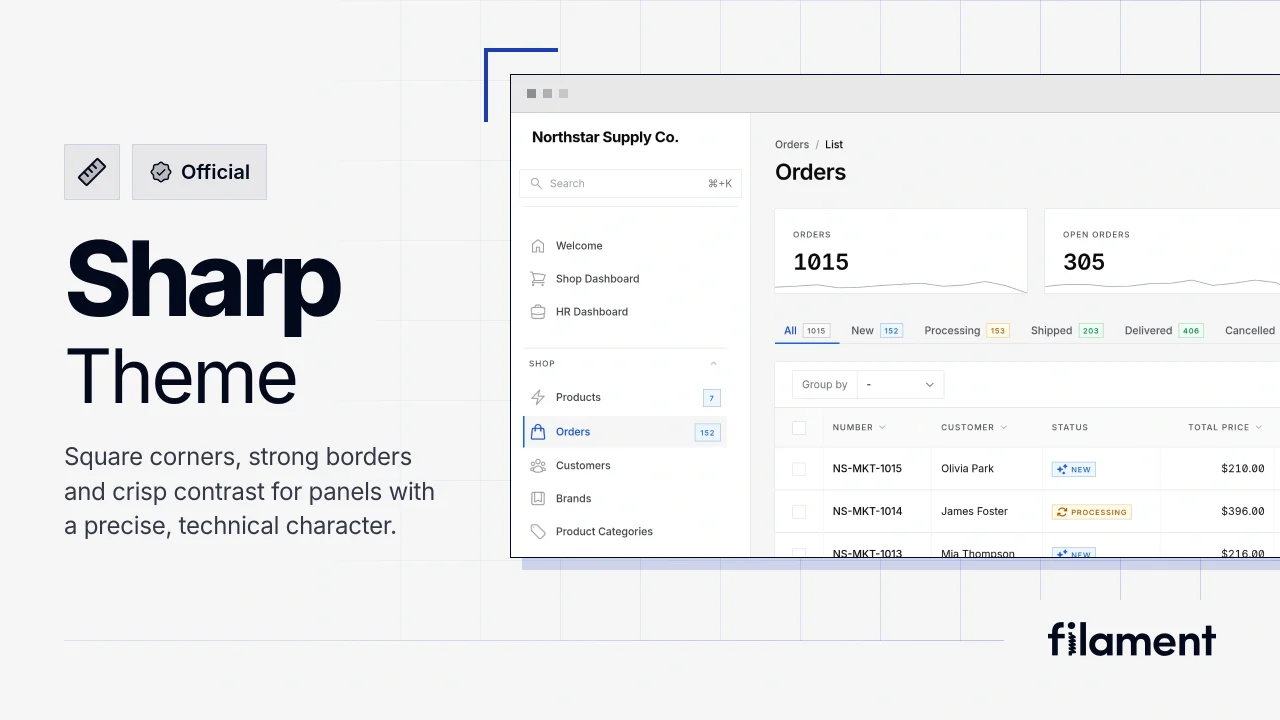
Sharp Theme
A theme that gives panels a precise, technical look with square corners, strong borders, and clear contrast.
 Filament
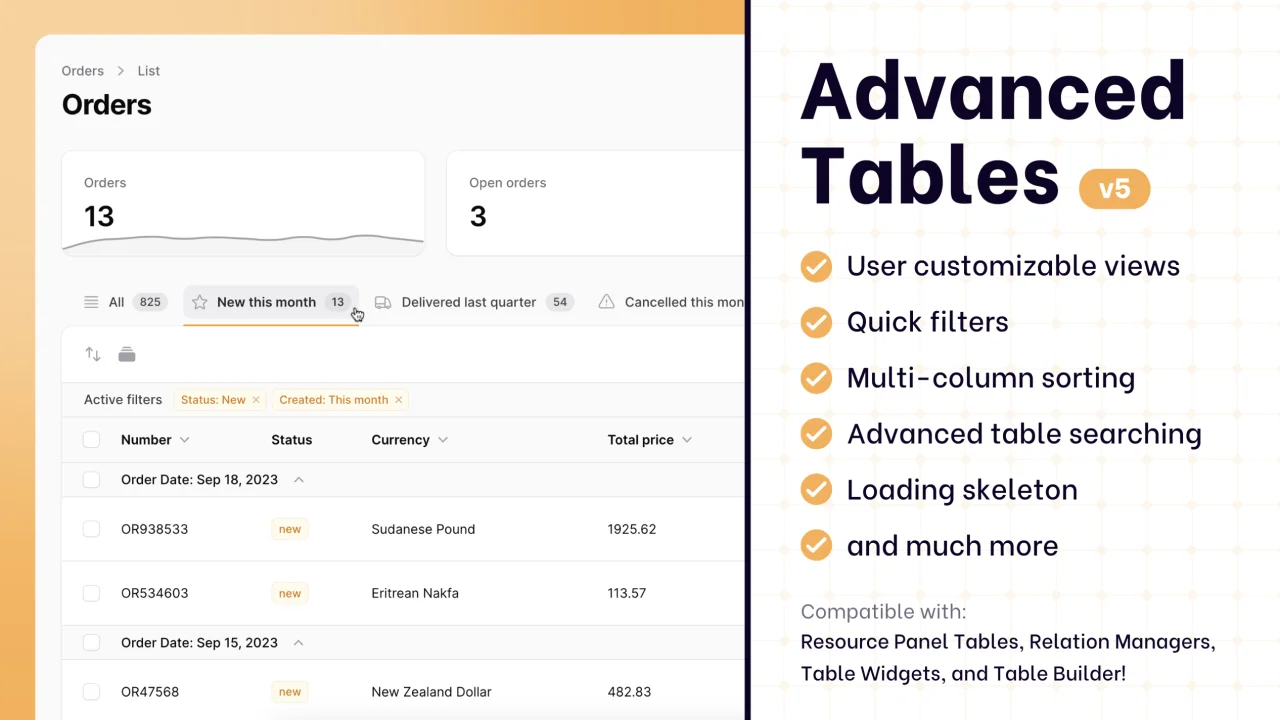
Advanced Tables (formerly Filter Sets)
Supercharge your tables with powerful features like user-customizable views, quick filters, multi-column sorting, advanced table searching, convenient view management, and more. Compatible with Resource Panel Tables, Relation Managers, Table Widgets, and Table Builder!
 Kenneth Sese
Blueprint
Filament Blueprint is a premium Laravel Boost extension that helps AI agents produce accurate, detailed implementation plans and security reports for Filament apps.
Filament