
Pirsch Dashboard Widget by Develogix Agency
CommunityDisplay the most interesting Pirsch analytics data in your dashboard.
 Author:
Develogix Agency
Author:
Develogix Agency
Package health
Automated checks of this plugin's Composer package
15 checks
- Failed: GitHub Actions pinned to SHA — View details on Plumb
- Skipped: GitLab CI includes pinned to SHA
- Passed: Open security advisories
- Passed: Dependabot PR responsiveness — No open Dependabot PRs.
- Skipped: Renovate MR responsiveness
- Failed: Dependabot or Renovate configured — No dependency updater configuration found. View details on Plumb
- Skipped: Dependency update cooldown configured
- Passed: Provides a security policy
- Passed: Abandoned or archived — No consulted source marks the package abandoned (packagist, github).
- Failed: Commit and release recency — Inactive: last commit 881 days ago; last release 887 days ago. View details on Plumb
-
Passed:
composer.lock not committed by library
—
composer.lockis absent from the released dist archive. - Passed: Dist archive is lean
-
Failed:
Current Laravel version supported
—
The newest Laravel line verified to co-install with the package is
11.0, which is end-of-life. Lines13.0,12.0could not be fully verified: no solution was found among the newest package versions, and resolving the complete version pool exceeded solver resource budgets, so support there cannot be ruled out. View details on Plumb -
Passed:
Current PHP version supported
—
Constraint
^8.1|^8.2|^8.3supports current PHP8.5. - Skipped: Current Symfony version supported
filament/
namespace. Review the source and install at your own risk. Found
malware or an unresolved security issue the author won't
address?
Report it
.
Documentation
- Screenshots
- Installation
- Usage
- Using the raw Analytics functions
- Testing
- Changelog
- Contributing
- Security Vulnerabilities
- Credits
- License





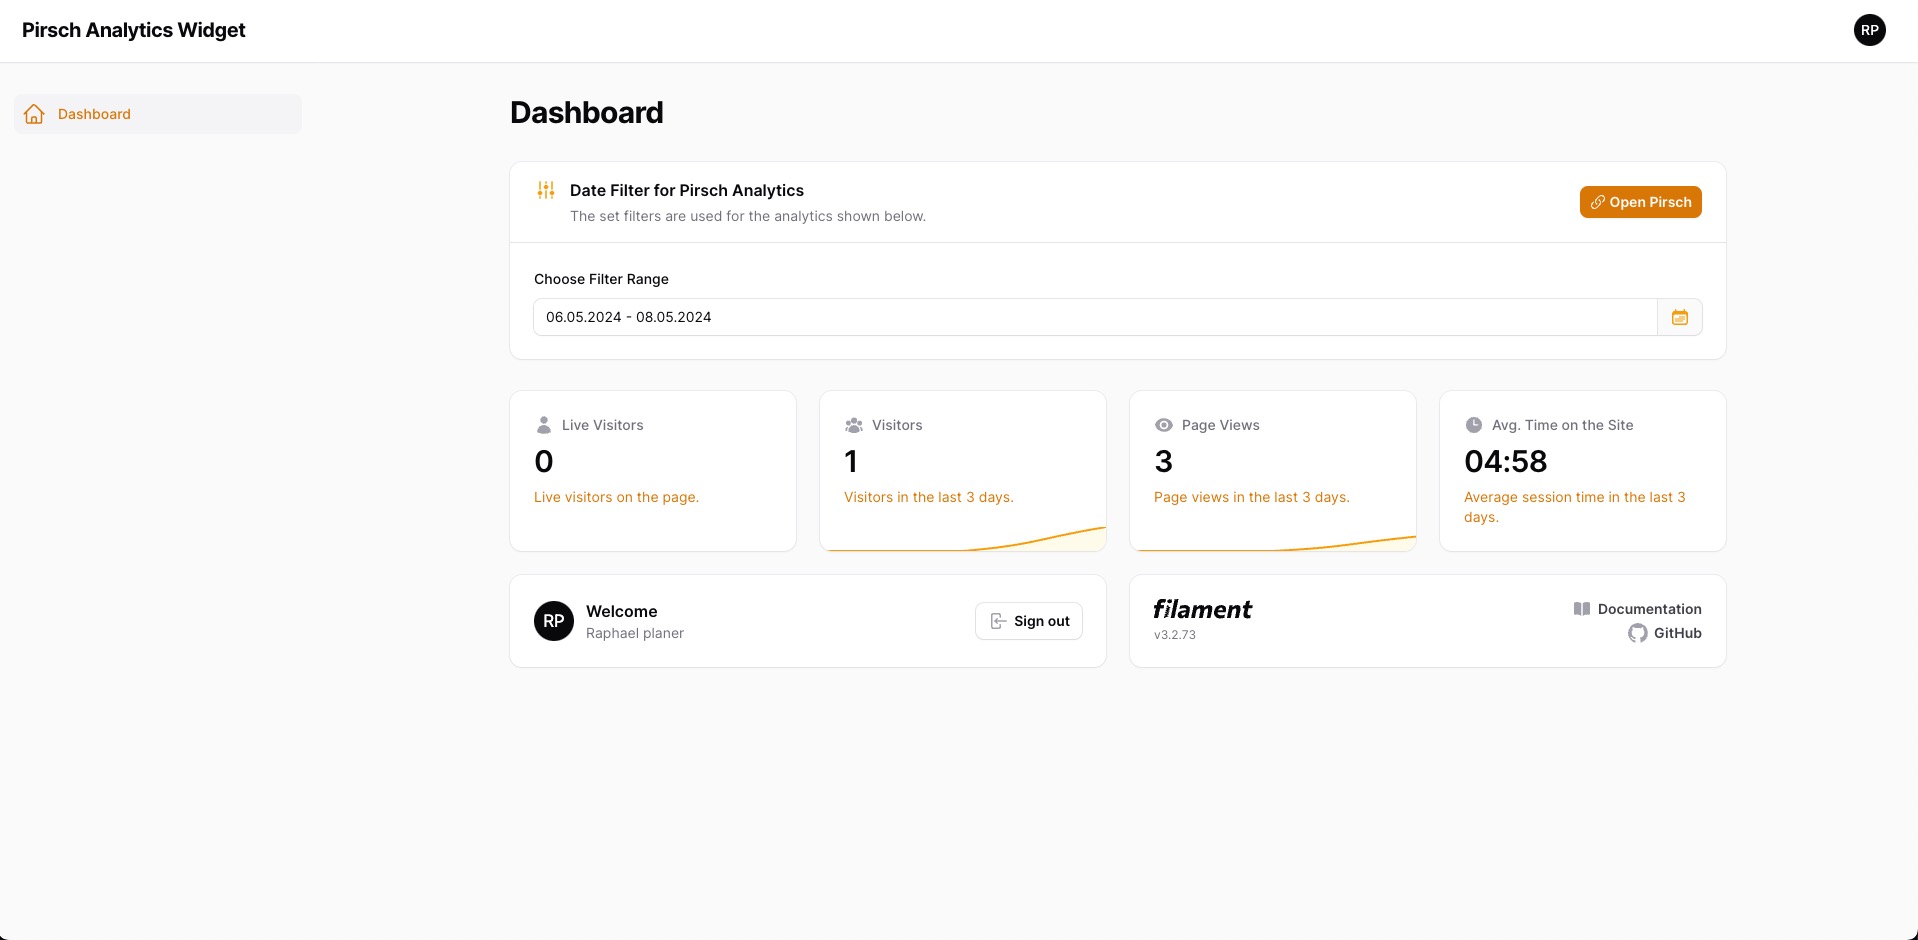
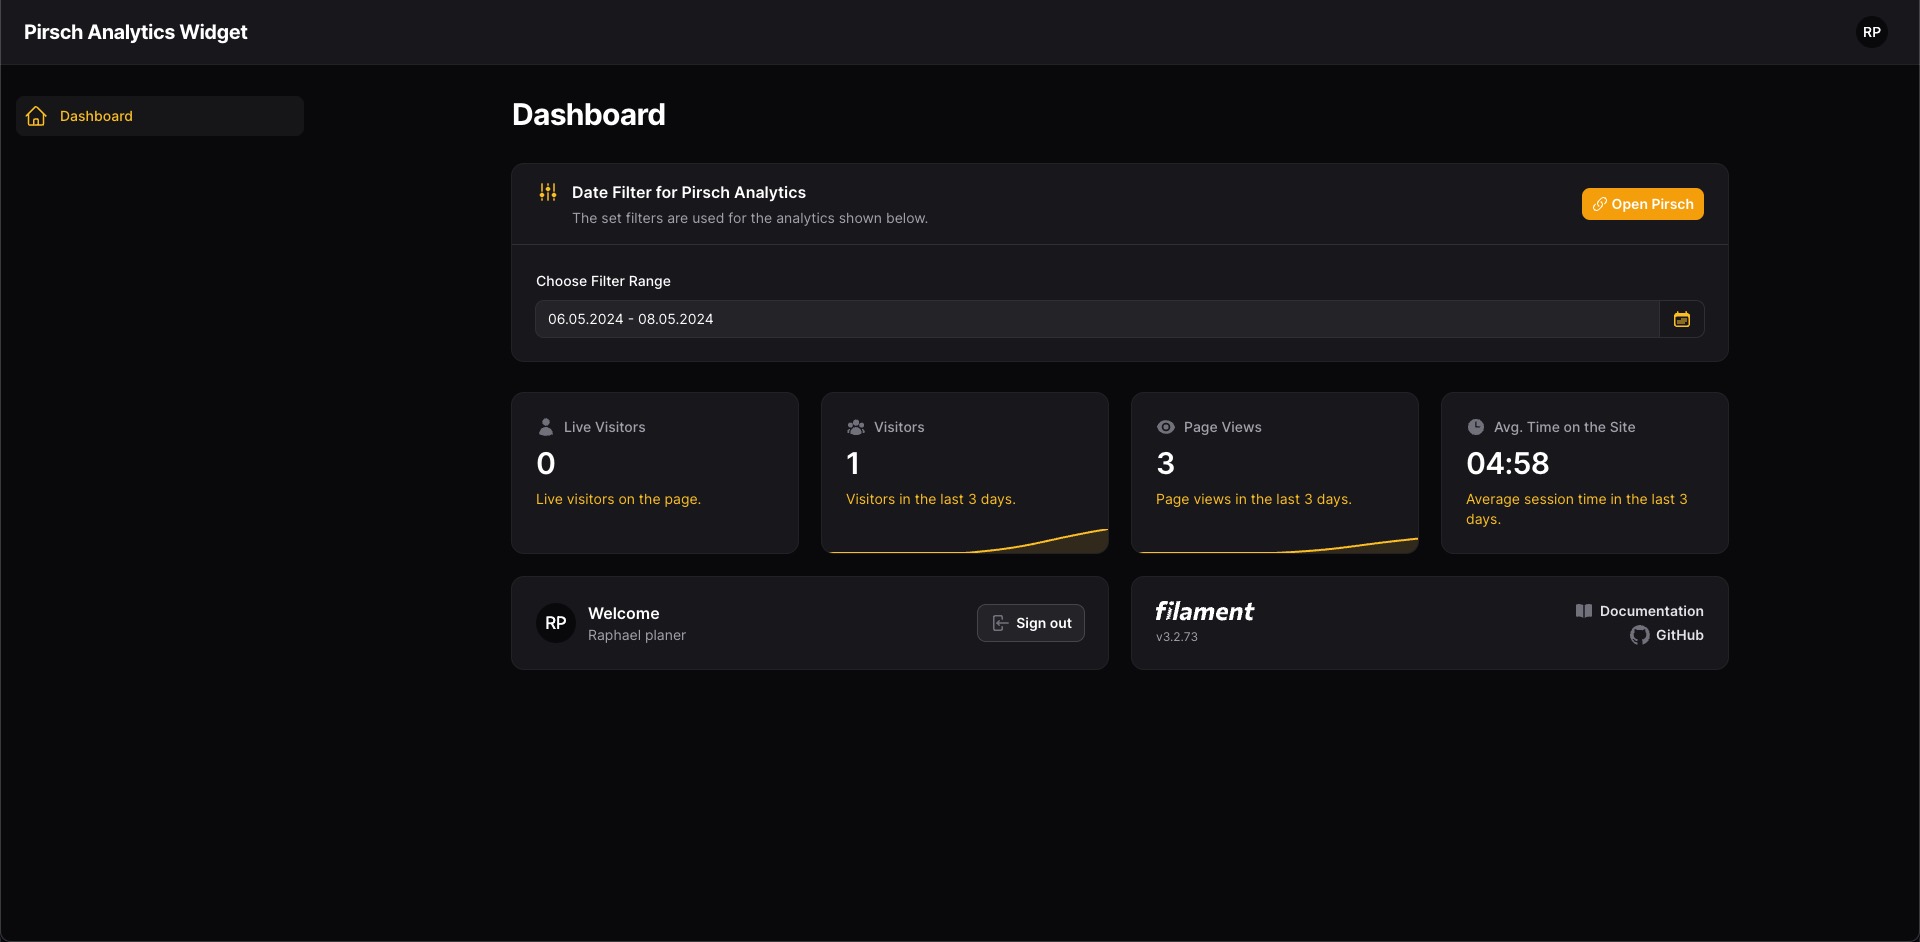
This package allows you to integrate a simple analytics dashboard widget for panel.
#Screenshots
#Installation
You can install the package via composer:
composer require devlogx/filament-pirsch-dashboard-widget
Get the Pirsch access token and add it your env file.
- Visit the Pirsch "Integration" settings page.
- Make sure the correct domain is selected in the top left corner of the page.
- Scroll down to the "Clients" section and press the "Add Client" button.
- Select "oAuth (ID + secret)" as type and enter a description.
- Press the "Create Client" button and copy the generated "Client id and Client secret".
- Add the copied id and secret to your
.envfile:
# ...
PIRSCH_CLIENT_ID=xxxxxxxxxxxxxxxxxxxxxxxxxxxxxxxxxxxxxxxxxxxxx
PIRSCH_CLIENT_SECRET=xxxxxxxxxxxxxxxxxxxxxxxxxxxxxxxxxxxxxxxxxxxxx
You can publish the config file with:
php artisan vendor:publish --tag="filament-pirsch-dashboard-widget-config"
Optionally, you can publish the translations using
php artisan vendor:publish --tag="filament-pirsch-dashboard-widget-translations"
This is the contents of the published config file:
return [
    /*
    |--------------------------------------------------------------------------
    | Pirsch Client id & Client secret
    |--------------------------------------------------------------------------
    |
    | You can acquire your client id and secret id under
    | https://dashboard.pirsch.io/settings/integration
    |
    */
    'client_id' => env('PIRSCH_CLIENT_ID', null),
    'client_secret' => env('PIRSCH_CLIENT_SECRET', null),

    /*
    |--------------------------------------------------------------------------
    | Stats cache ttl
    |--------------------------------------------------------------------------
    |
    | This value is the ttl for the displayed dashboard
    | stats values. You can increase or decrease
    | this value.
    |
    */
    'cache_time' => 300,
];
#Usage
#Create own Dashboard file
Under Filament/Pages/ create a new file called Dashboard.php with following contents:
<?php

namespace App\Filament\Pages;

use Devlogx\FilamentPirsch\Concerns\HasFilter;

class Dashboard extends \Filament\Pages\Dashboard
{
    use HasFilter;

}
#Remove the default Dashboard from your PanelProvider
->pages([
    //Pages\Dashboard::class,
])
Alternatively if you already have a custom Dashboard, add the HasFilter trait to your Dashboard file.
#Add the Widget to your PanelProvider
->widgets([
    Widgets\AccountWidget::class,
    Widgets\FilamentInfoWidget::class,
    \Devlogx\FilamentPirsch\Widgets\PirschStatsWidget::class,// <-- add this widget
])
#Add the plugin to your PanelProvider
->plugins([
    \Devlogx\FilamentPirsch\FilamentPirschPlugin::make()
])
#Configure the plugin
->plugins([
    \Devlogx\FilamentPirsch\FilamentPirschPlugin::make()
        ->pirschLink(true) //Direct link to pirsch analytics page
        ->pollingInterval("60s") //Auto polling interval
        ->filterSectionIcon("heroicon-s-adjustments-vertical")
        ->filterSectionIconColor("primary")
        ->liveVisitorIcon("heroicon-s-user") //First Block | Live Visitors
        ->liveVisitorColor("primary") //First Block | Live Visitors
        ->visitorsIcon("heroicon-s-user-group") //Second Block | All Visitors
        ->visitorsColor("primary") //Second Block | All Visitors
        ->viewsIcom("heroicon-s-eye") //Third Block | All Page Views
        ->visitorsColor("primary") //Third Block | All Page Views
        ->sessionTimeIcon("heroicon-s-clock") //Fourth Block | Avg. Session Time
        ->sessionTimeColor("primary") //Fourth Block | Avg. Session Time
])
#Using the raw Analytics functions
You can use the functions for your own widgets. There are plenty more available.
#Get Dashboard link
public function getDashboardLink(): string
{
    return 'https://' . $this->client->getDomain()->subdomain . '.pirsch.io';
}
#Defining the Filter
use Devlogx\FilamentPirsch\Concerns\Filter;

$filter = (new Filter())
    ->setFrom(Carbon::now()->subDays(30))
    ->setTo(Carbon::now())
    ->setFromTime(Carbon::now()->startOfDay())
    ->setToTime(Carbon::now()->endOfDay())
    ->setScale(\Devlogx\FilamentPirsch\Enums\Scale::SCALE_DAY) // can be 'SCALE_DAY', 'SCALE_MONTH', 'SCALE_WEEK' or 'SCALE_YEAR'
    ->setEvent("name of event")
    ->setEventMetaKey("meta key");
#Get different data
use Devlogx\FilamentPirsch\Facades\FilamentPirsch;

//Get active visitors
$activeVisitors = FilamentPirsch::activeVisitors($filter,false);

//Get avg session duration
$sessionDuration = FilamentPirsch::sessionDuration($filter,false);

//Get visitors
$visitors = FilamentPirsch::visitors($filter,false);

//Get page views
$views = FilamentPirsch::views($filter,false);

//Get avg time on page
$timeOnPage = FilamentPirsch::timeOnPage($filter,false);

//Get events
$events = FilamentPirsch::events($filter,false);

//Get event meta data
$eventMetaData = FilamentPirsch::eventMetaData($filter,false);

//Get languages
$languages = FilamentPirsch::languages($filter,false);

//Get referrer listed
$referrer = FilamentPirsch::referrer($filter,false);

//Get os listed
$os = FilamentPirsch::os($filter,false);

//Get platforms listed
$platform = FilamentPirsch::platform($filter,false);

//Get a list of used keywords
$keywords = FilamentPirsch::keywords($filter,false);
#Testing
composer test
#Changelog
Please see CHANGELOG for more information on what has changed recently.
#Contributing
Please see CONTRIBUTING for details.
#Security Vulnerabilities
Please review our security policy on how to report security vulnerabilities.
#Credits
#License
The MIT License (MIT). Please see License File for more information.
The author
Develogix Agency, based in Austria, is a Fullstack web development firm specializing in the TALL stack and Filament. Known for delivering robust and efficient digital solutions, Develogix excels in creating intuitive and sophisticated web experiences tailored to diverse client needs.
From the same author
Featured Plugins
A selection of plugins curated by the Filament team
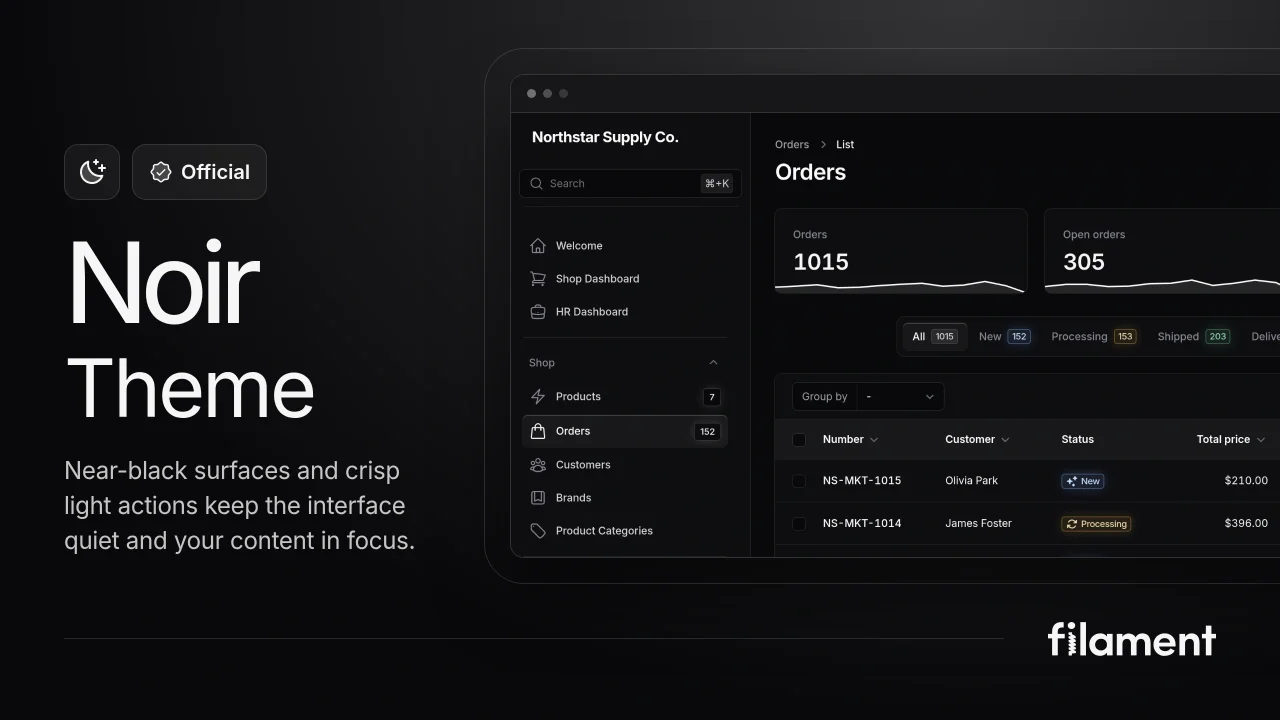
Noir Theme
A theme that gives panels a focused, refined look with near-black surfaces, crisp actions, and restrained color.
 Filament
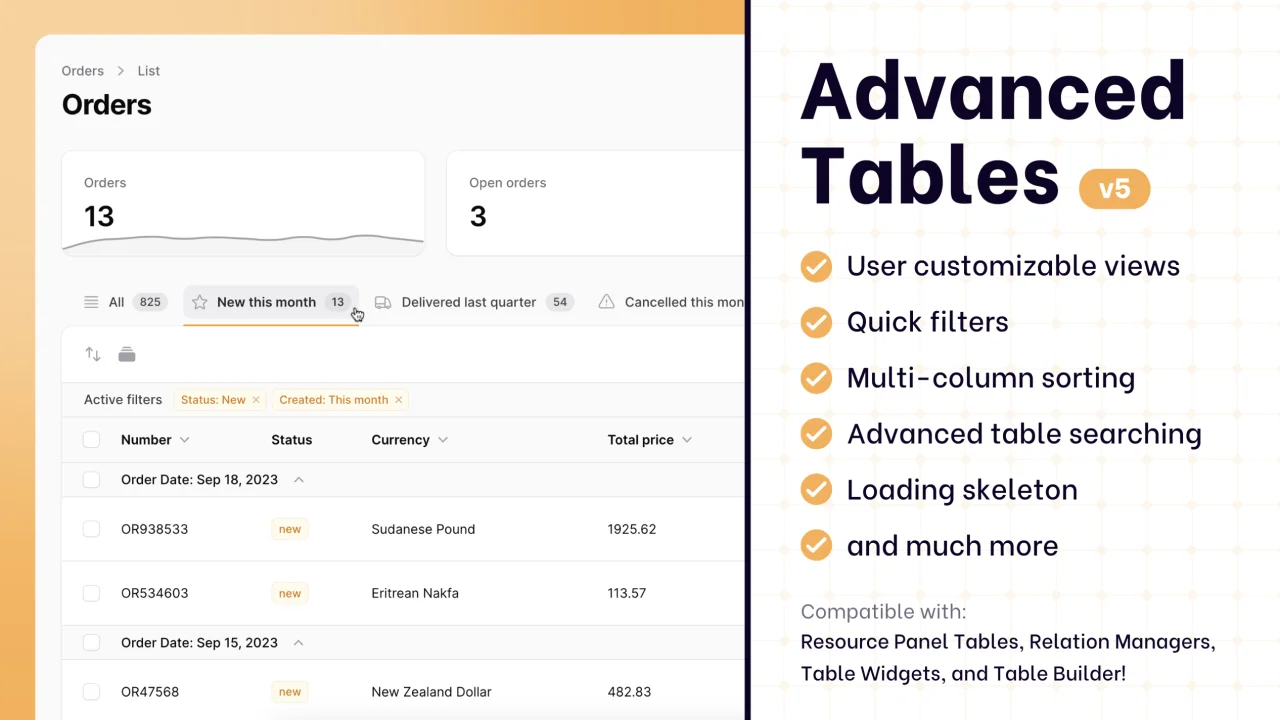
Advanced Tables (formerly Filter Sets)
Supercharge your tables with powerful features like user-customizable views, quick filters, multi-column sorting, advanced table searching, convenient view management, and more. Compatible with Resource Panel Tables, Relation Managers, Table Widgets, and Table Builder!
 Kenneth Sese
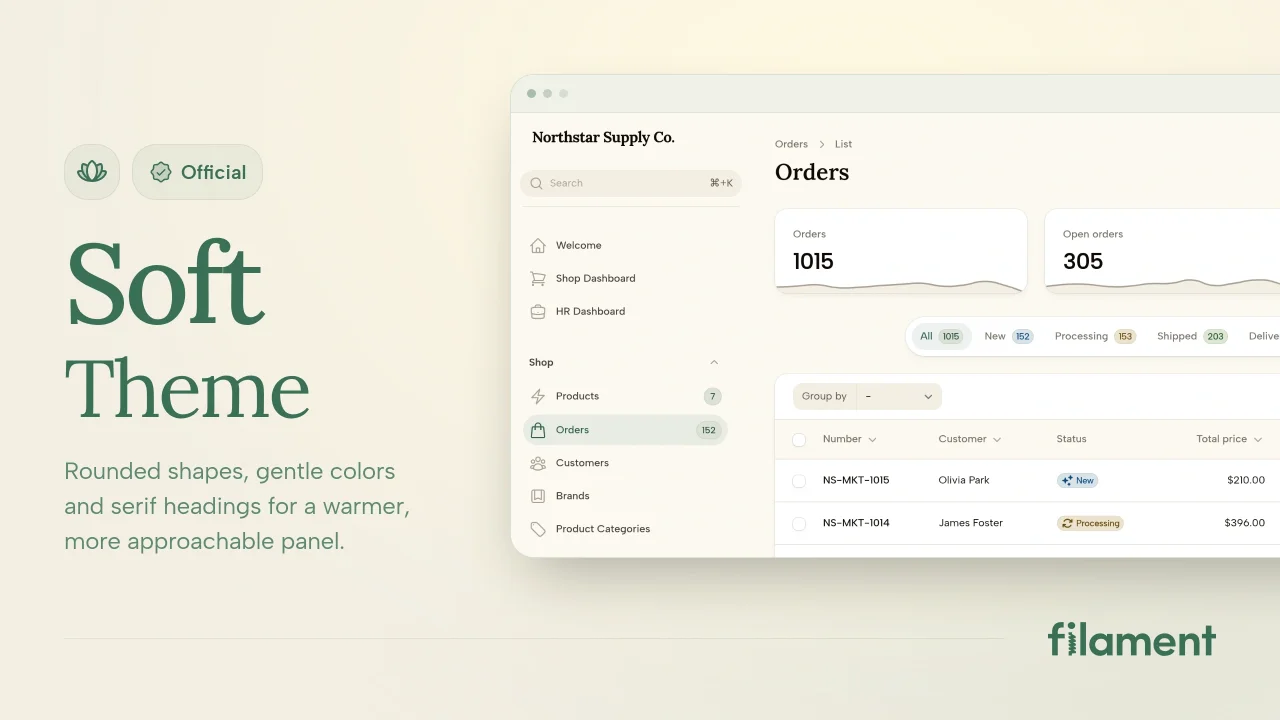
Soft Theme
A theme that gives panels a warm, approachable look with rounded shapes, gentle colors, and serif headings.
Filament