Fathom Dashboard Widget
CommunityDisplay the most interesting Fathom analytics data in your dashboard.
filament/
namespace. Review the source and install at your own risk. Found
malware or an unresolved security issue the author won't
address?
Report it
.
 Author:
Develogix Agency
Author:
Develogix Agency
Documentation
- Screenshots
- Installation
- Usage
- Using the raw Analytics functions
- Testing
- Changelog
- Contributing
- Security Vulnerabilities
- Credits
- License


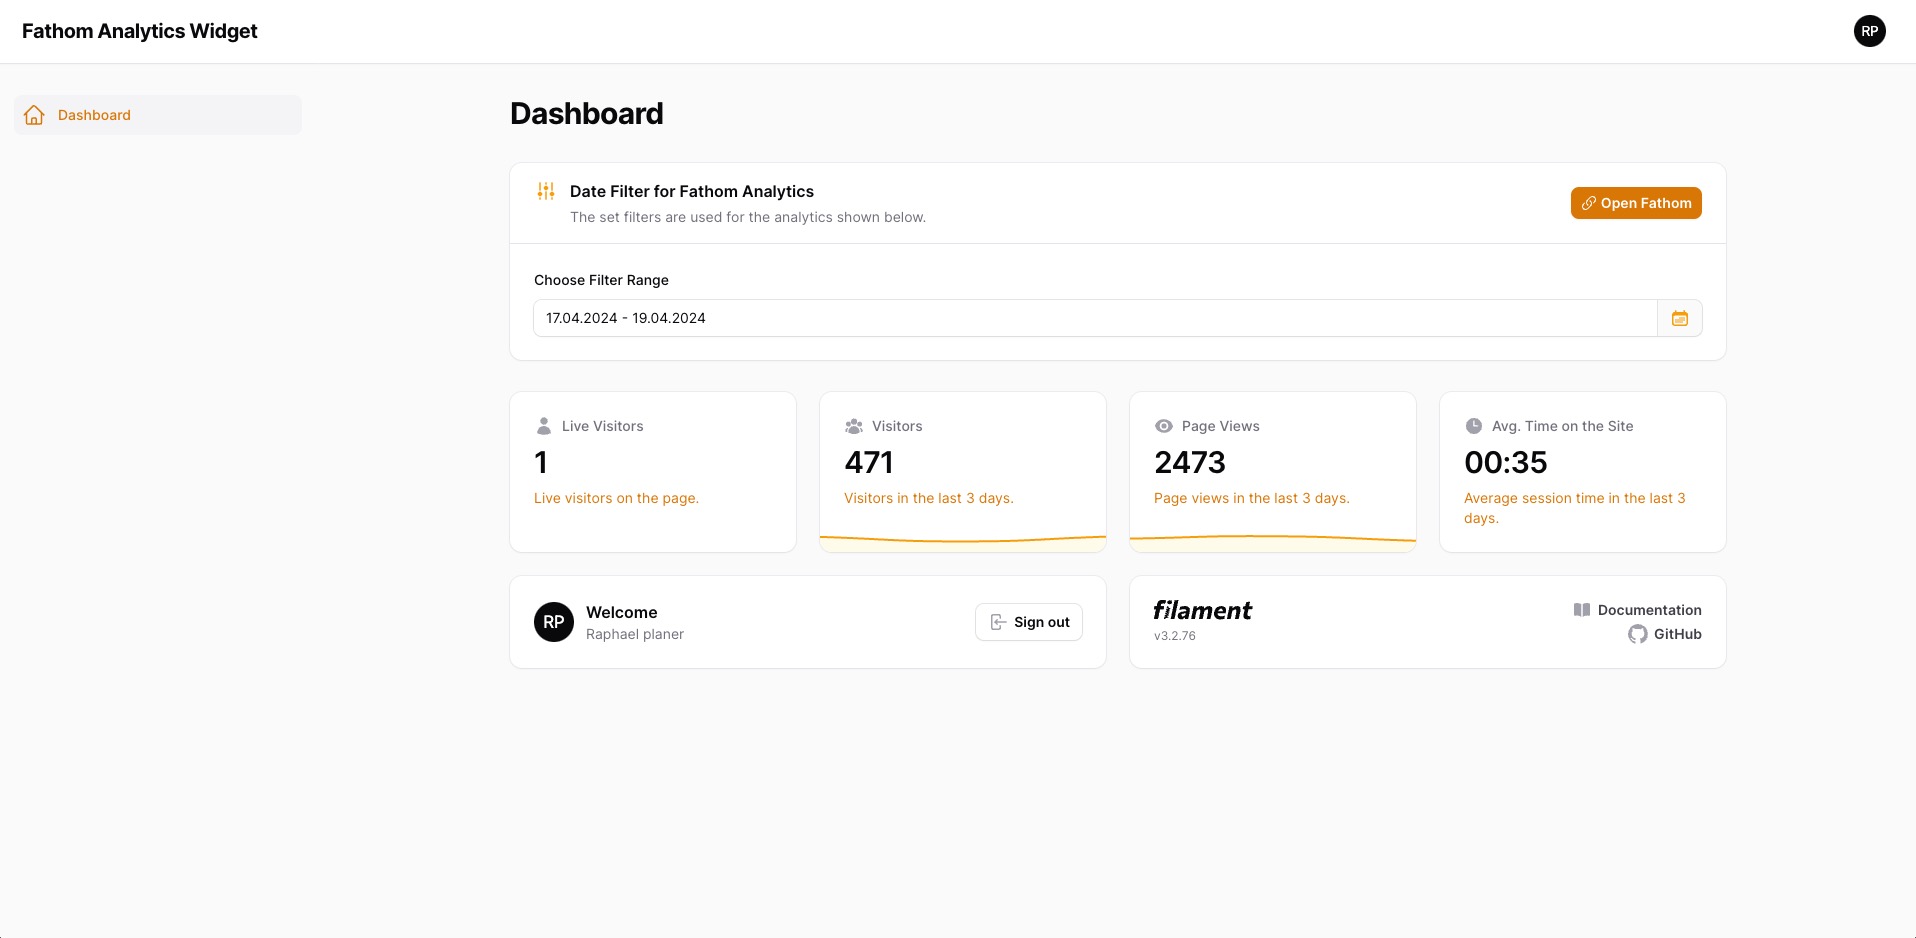
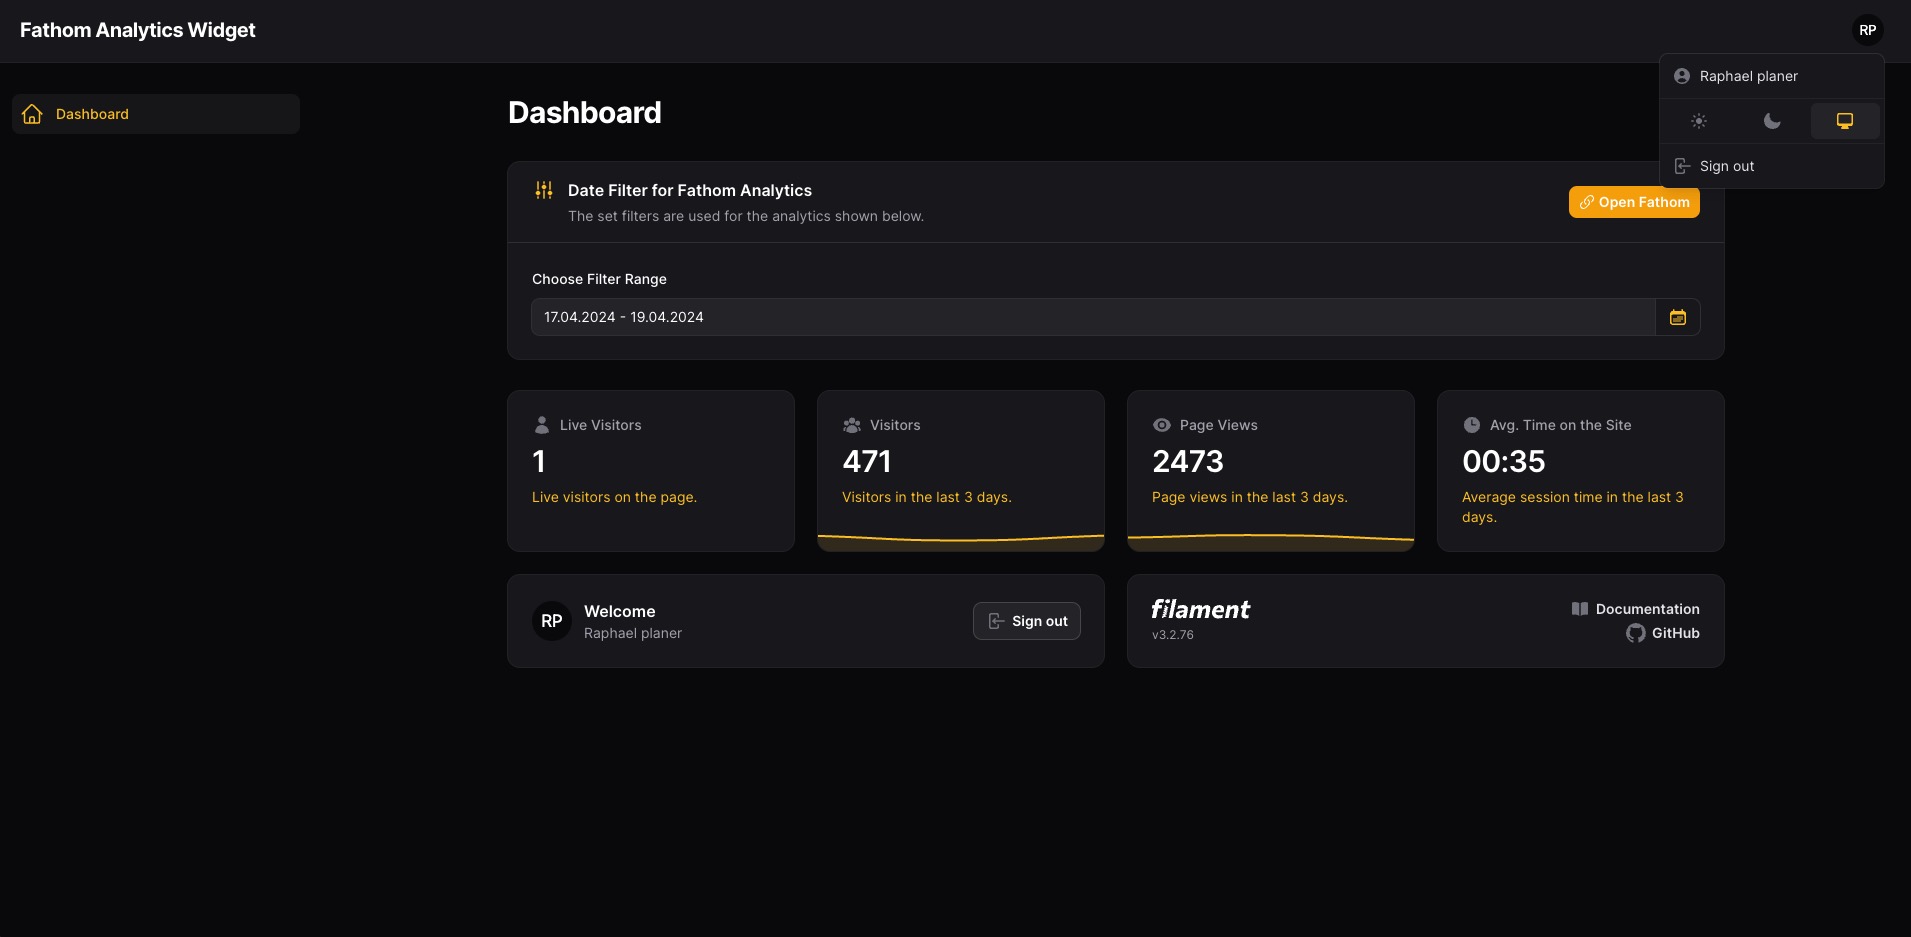
This package allows you to integrate a simple analytics dashboard widget for panel.
#Screenshots
#Installation
You can install the package via composer:
composer require devlogx/filament-fathom-dashboard-widget
Get the Fathom API-Token and add it your env file.
- Visit the Fathom "API" settings page.
- Login and click "Create New".
- Give your token a name.
- Select under Permissions "Site-specific key".
- Select your Site and below "Read".
- Add the copied API-Token to your
.envfile:
# ...
FATHOM_API_TOKEN="xxxxx|xxxxxxxxxxxxxxxxxxx"
FATHOM_SITE_ID="XXXXXXX"
You can publish the config file with:
php artisan vendor:publish --tag="filament-fathom-dashboard-widget-config"
Optionally, you can publish the translations using
php artisan vendor:publish --tag="filament-fathom-dashboard-widget-translations"
This is the contents of the published config file:
return [
    /*
    |--------------------------------------------------------------------------
    | Fathom API-Token & Site id
    |--------------------------------------------------------------------------
    |
    | You can acquire your API-Token from the url below:
    | https://app.usefathom.com/api
    |
    */
    'api_token' => env('FATHOM_API_TOKEN'),
    'site_id' => env('FATHOM_SITE_ID'),

    /*
    |--------------------------------------------------------------------------
    | Fathom Domain
    |--------------------------------------------------------------------------
    |
    | If you're from the EU, I can recommend using the EU CDN:
    | cdn-eu.usefathom.com
    |
    */
    'domain' => env('FATHOM_DOMAIN', 'cdn.usefathom.com'),

    /*
    |--------------------------------------------------------------------------
    | Stats cache ttl
    |--------------------------------------------------------------------------
    |
    | This value is the ttl for the displayed dashboard
    | stats values. You can increase or decrease
    | this value.
    |
    */
    'cache_time' => 300,
];
#Usage
#Create own Dashboard file
Under Filament/Pages/ create a new file called Dashboard.php with following contents:
<?php

namespace App\Filament\Pages;

use Devlogx\FilamentFathom\Concerns\HasFilter;

class Dashboard extends \Filament\Pages\Dashboard
{
    use HasFilter;

}
#Remove the default Dashboard from your PanelProvider
->pages([
    //Pages\Dashboard::class,
])
Alternatively if you already have a custom Dashboard, add the HasFilter trait to your Dashboard file.
#Add the Widget to your PanelProvider
->widgets([
    Widgets\AccountWidget::class,
    Widgets\FilamentInfoWidget::class,
    \Devlogx\FilamentFathom\Widgets\FathomStatsWidget::class,// <-- add this widget
])
#Add the plugin to your PanelProvider
->plugins([
    \Devlogx\FilamentFathom\FilamentFathomPlugin::make()
])
#Configure the plugin
->plugins([
    \Devlogx\FilamentFathom\FilamentFathomPlugin::make()
        ->fathomLink(true) //Direct link to fathom analytics page
        ->pollingInterval("60s") //Auto polling interval
        ->filterSectionIcon("heroicon-s-adjustments-vertical")
        ->filterSectionIconColor("primary")
        ->liveVisitorIcon("heroicon-s-user") //First Block | Live Visitors
        ->liveVisitorColor("primary") //First Block | Live Visitors
        ->visitorsIcon("heroicon-s-user-group") //Second Block | All Visitors
        ->visitorsColor("primary") //Second Block | All Visitors
        ->viewsIcom("heroicon-s-eye") //Third Block | All Page Views
        ->visitorsColor("primary") //Third Block | All Page Views
        ->sessionTimeIcon("heroicon-s-clock") //Fourth Block | Avg. Session Time
        ->sessionTimeColor("primary") //Fourth Block | Avg. Session Time
])
#Using the raw Analytics functions
You can use the functions for your own widgets. There are plenty more available.
#Get Dashboard link
use Devlogx\FilamentFathom\Facades\FilamentFathom;

$dashboardLink = FilamentFathom::getDashboardLink();
#Defining the Filter
use Devlogx\FilamentFathom\Concerns\Filter;

$filter = (new Filter())
    ->setFrom(Carbon::now()->subDays(30))
    ->setTo(Carbon::now());
#Get different data
use Devlogx\FilamentFathom\Facades\FilamentFathom;

//Get active visitors
$activeVisitors = FilamentFathom::activeVisitors($filter,false);

//Get avg session duration
$sessionDuration = FilamentFathom::sessionDuration($filter,false);

//Get visitors
$visitors = FilamentFathom::visitors($filter,false);

//Get page views
$views = FilamentFathom::views($filter,false);
#Testing
composer test
#Changelog
Please see CHANGELOG for more information on what has changed recently.
#Contributing
Please see CONTRIBUTING for details.
#Security Vulnerabilities
Please review our security policy on how to report security vulnerabilities.
#Credits
#License
The MIT License (MIT). Please see License File for more information.
The author
Develogix Agency, based in Austria, is a Fullstack web development firm specializing in the TALL stack and Filament. Known for delivering robust and efficient digital solutions, Develogix excels in creating intuitive and sophisticated web experiences tailored to diverse client needs.
From the same author

Featured Plugins
A selection of plugins curated by the Filament team

Blueprint
Filament Blueprint is a premium Laravel Boost extension that helps AI agents produce accurate, detailed implementation plans and security reports for Filament apps.
 Filament
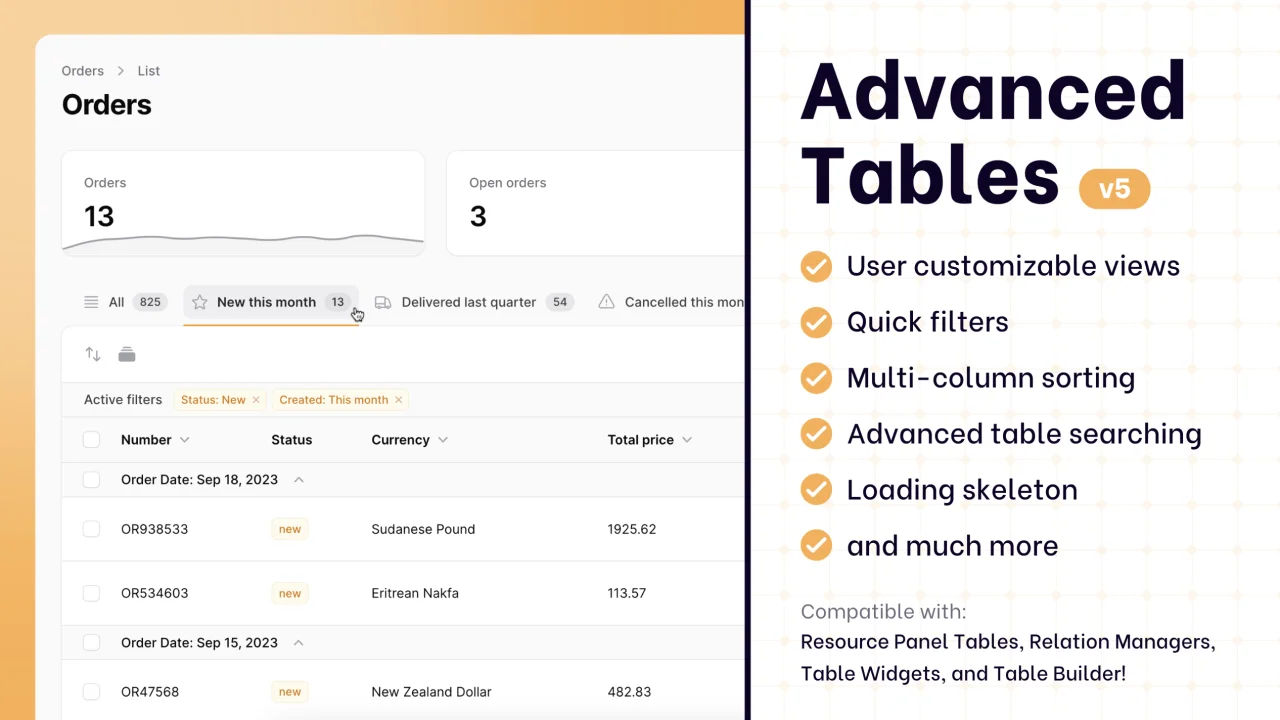
Advanced Tables (formerly Filter Sets)
Supercharge your tables with powerful features like user-customizable views, quick filters, multi-column sorting, advanced table searching, convenient view management, and more. Compatible with Resource Panel Tables, Relation Managers, Table Widgets, and Table Builder!
 Kenneth Sese
Custom Fields
Eliminate custom field migrations forever. Let your users create and manage form fields directly in Filament admin panels with 20+ built-in field types, validation, and zero database changes.
 Relaticle