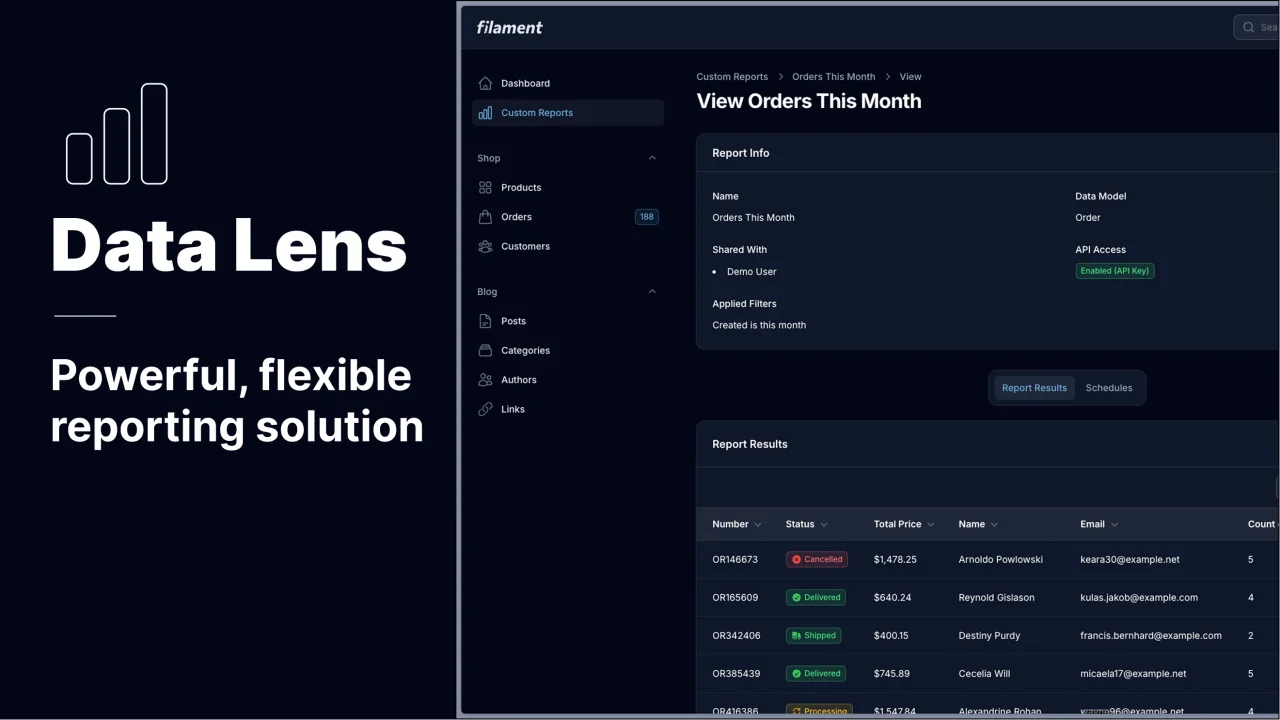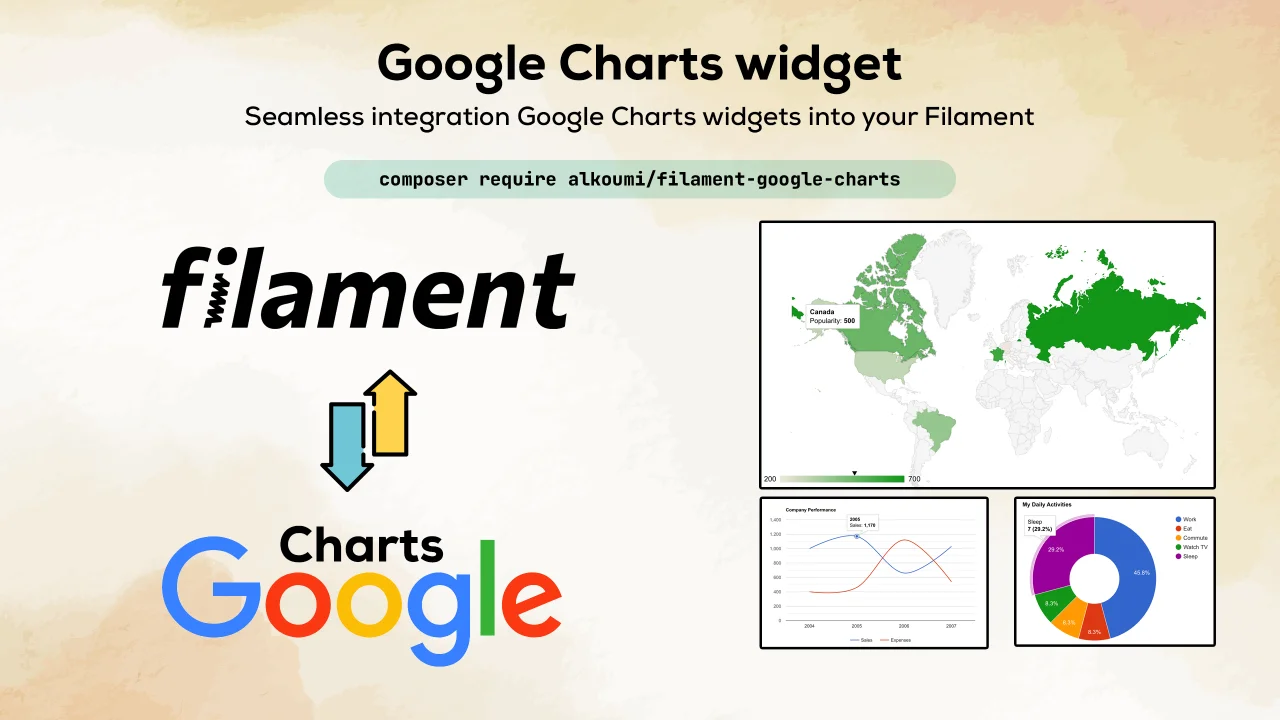
Google Charts
Seamless integration of Google Charts widgets into your Filament.
 Author:
Mohamed Alkoumi
Author:
Mohamed Alkoumi
Documentation
- See Google Charts examples Google Charts.
- Installation
- Usage
- Available chart types
- Live updating (polling)
- Chart configuration options
- Changelog
- Credits
- License


A seamless integration of Google Charts Widgets into your FilamentPHP applications.
#See Google Charts examples Google Charts.
#Installation
#Step 1: Install via Composer
composer require alkoumi/filament-google-charts
You can publish the config file with:
php artisan vendor:publish --tag=filament-google-charts-config
The config file contains default global customization options for better charts rendering in light/dark theme based on
the great work of Weekdone
Optionally, you can publish the view using:
php artisan vendor:publish --tag=filament-google-charts-views
#Usage
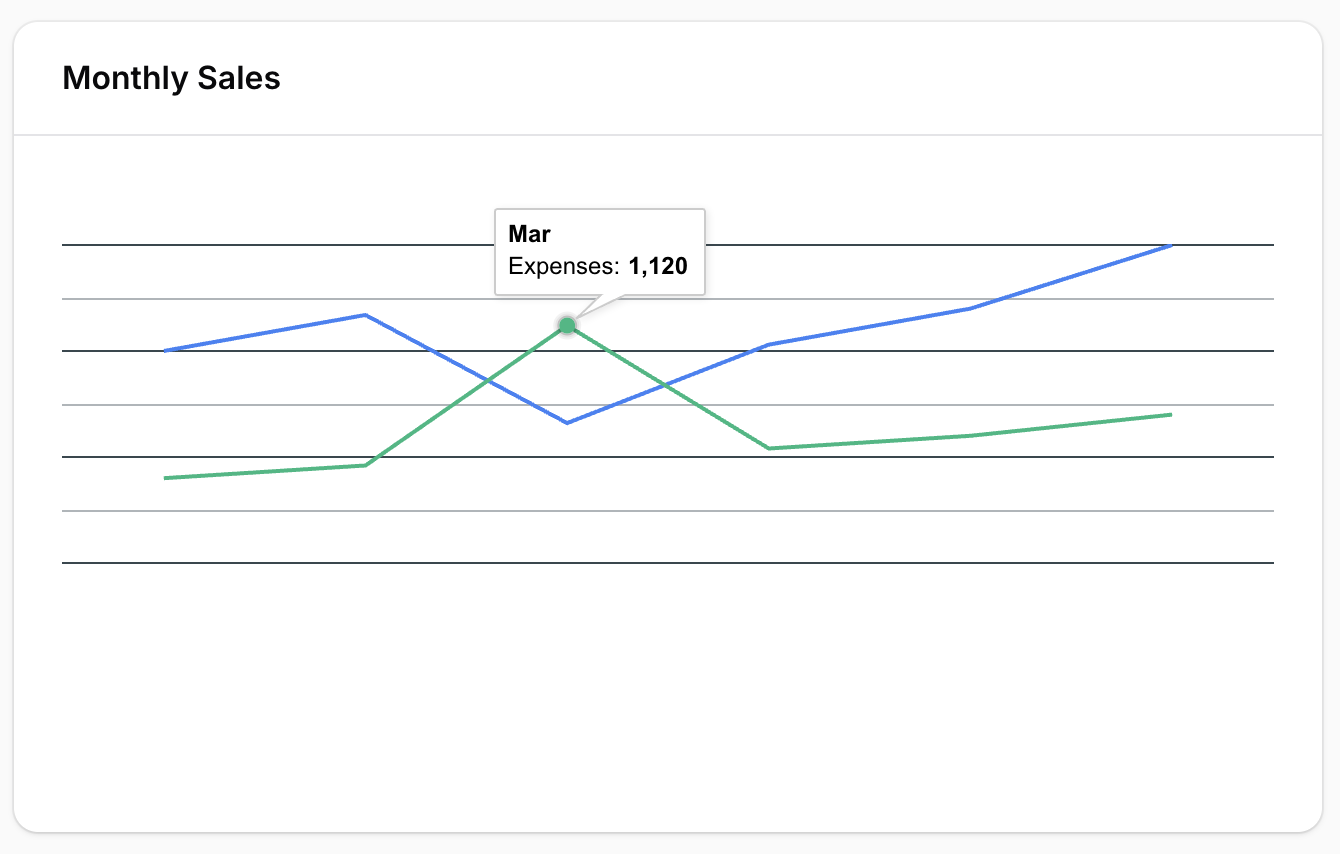
#Line charts
use Alkoumi\FilamentGoogleCharts\Widgets\LineChartWidget;

class SalesChartWidget extends LineChartWidget
{
    protected static ?string $heading = 'Monthly Sales';

    protected static ?int $sort = 1;

    protected static ?array $options = [
        'legend' => ['position' => 'bottom'],
        'colors' => ['#3b82f6', '#10b981'],
    ];

    protected function getData(): array
    {
        return [
            ['Month', 'Sales', 'Expenses'],
            ['Jan', 1000, 400],
            ['Feb', 1170, 460],
            ['Mar', 660, 1120],
            ['Apr', 1030, 540],
            ['May', 1200, 600],
            ['Jun', 1500, 700],
        ];
    }
}
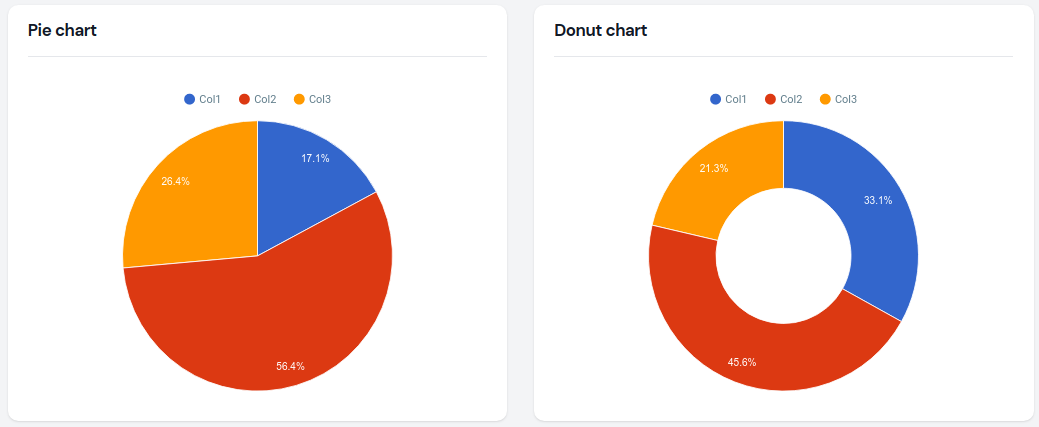
#Pie chart
use Alkoumi\FilamentGoogleCharts\Widgets\PieChartWidget;

class RegionalSalesWidget extends PieChartWidget
{
    protected static ?string $heading = 'Sales by Region';

    protected static ?int $sort = 2;

    protected int | string | array $columnSpan = 1;

    protected static ?array $options = [
        'pieHole' => 0.4,
        'colors' => ['#3b82f6', '#10b981', '#f59e0b', '#ef4444'],
    ];

    protected function getData(): array
    {
        return [
            ['Region', 'Sales'],
            ['North', 1200],
            ['South', 900],
            ['East', 1500],
            ['West', 800],
        ];
    }
}
#Donut chart
use Alkoumi\FilamentGoogleCharts\Widgets\DonutChartWidget;

class DemoDonutChart extends DonutChartWidget
{
    protected static ?string $heading = 'Donut chart';

    protected static ?int $sort = 2;

    protected static ?float $pieHole = 0.5;

    protected static ?array $options = [
        'legend' => [
            'position' => 'top',
        ],
        'height' => 400,
    ];

    protected function getData(): array
    {
        return [
            ['Label', 'Aggregate'],
            ['Col1', 17.2],
            ['Col2', 23.7],
            ['Col3', 11.1],
        ];
    }
}
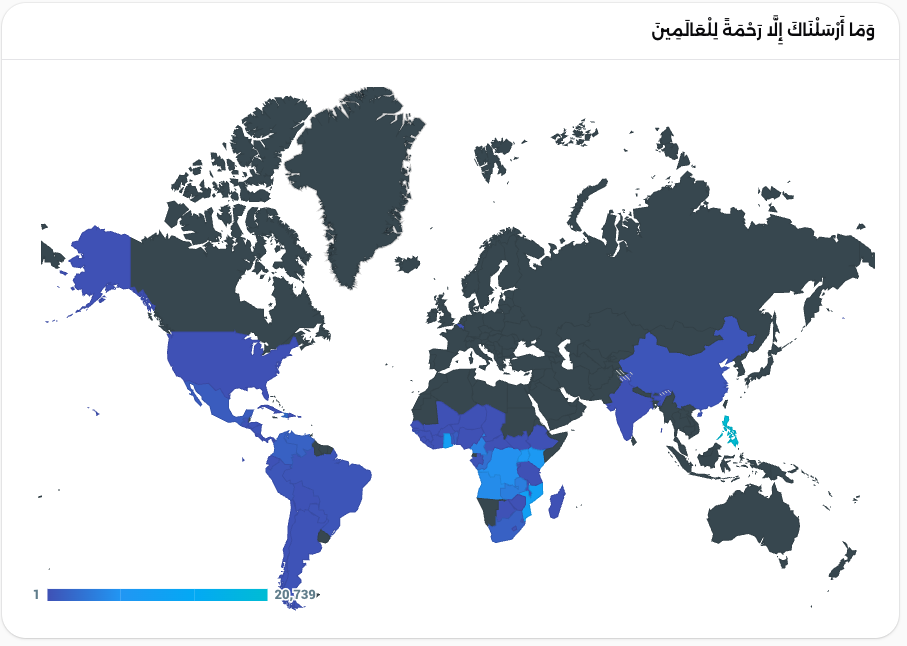
#Geo chart || Maps chart
use Alkoumi\FilamentGoogleCharts\Widgets\GeoChartWidget;

class GeoSalesWidget extends GeoChartWidget
{
    protected static ?string $heading = 'Sales by Country';

    protected static ?int $sort = 3;

    protected int | string | array $columnSpan = 'full';

    protected static ?array $options = [
        'colorAxis' => [
            'colors' => ['#bbdefb', '#1976d2'],
        ],
    ];

    protected function getData(): array
    {
        return [
            ['Country', 'Sales'],
            ['United States', 5000],
            ['Germany', 3000],
            ['Brazil', 2500],
            ['Canada', 2000],
            ['France', 1800],
            ['United Kingdom', 1500],
            ['Australia', 1200],
            ['Japan', 1000],
            ['Egypt', 800],
            ['Saudi Arabia', 600],
        ];
    }
}
#Available chart types
Below is a list of available chart widget classes which you may extend, and their corresponding Google Charts documentation page, for inspiration what to return from getData():
Alkoumi\FilamentGoogleCharts\Widgets\GeoChartWidget - Google Charts documentation
Alkoumi\FilamentGoogleCharts\Widgets\AreaChartWidget - Google Charts documentation
Alkoumi\FilamentGoogleCharts\Widgets\BarChartWidget - Google Charts documentation
Alkoumi\FilamentGoogleCharts\Widgets\ColumnChartWidget - Google Charts documentation
Alkoumi\FilamentGoogleCharts\Widgets\DonutChartWidget - Google Charts documentation
Alkoumi\FilamentGoogleCharts\Widgets\LineChartWidget - Google Charts documentation
Alkoumi\FilamentGoogleCharts\Widgets\PieChartWidget - Google Charts documentation
#Live updating (polling)
By default, chart widgets refresh their data every 5 seconds.
To customize this, you may override the $pollingInterval property on the class to a new interval:
protected static ?string $pollingInterval = '10s';
Alternatively, you may disable polling:
protected static ?string $pollingInterval = null;
#Chart configuration options
You may specify an $options variable on the chart class to control the many configuration options that
the Google Charts library provides. For instance, you could change the position
off the legend for PieChartWidget class and set a custom height:
protected static ?array $options = [
        'legend' => [
            'position' => 'bottom',
        ],
        'height' => 300,
    ];
#Changelog
Please see CHANGELOG for more information on what has changed recently.
#Credits
#License
The MIT License (MIT). Please see License File for more information.
The author
From the same author
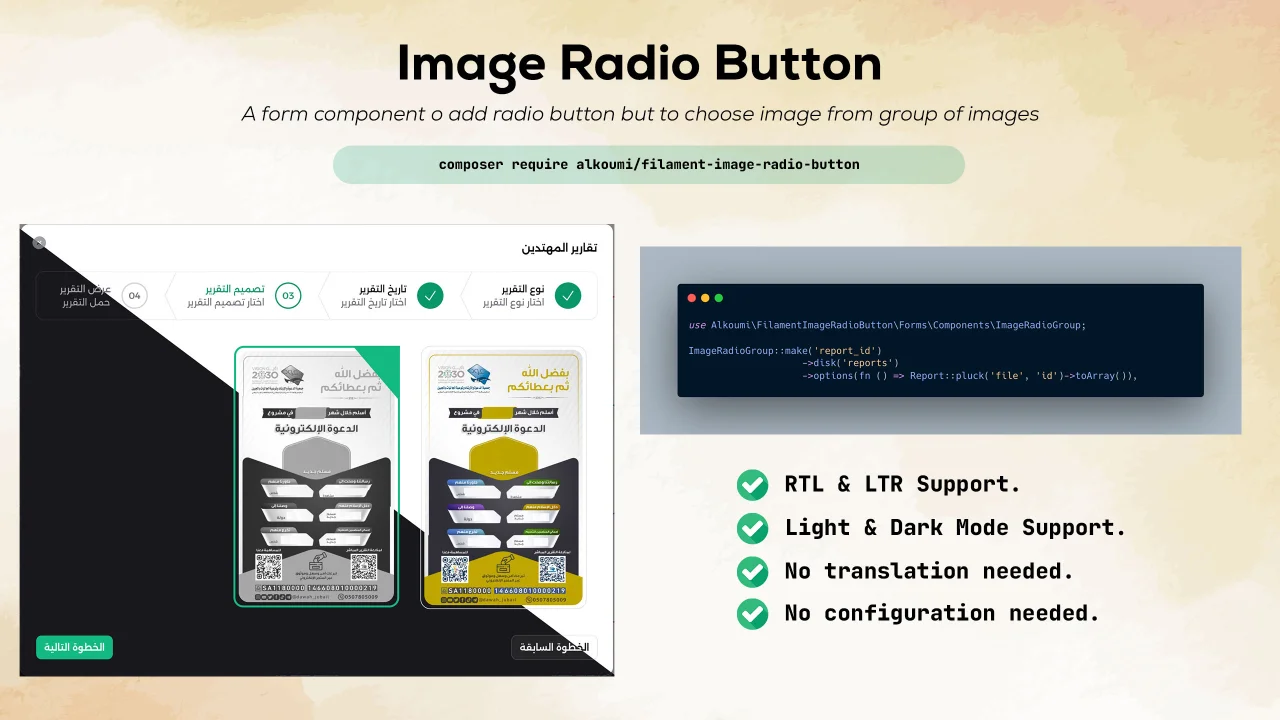
Image Radio Button
Add a radio button but with only images to filament forms.
Author:
Mohamed Alkoumi
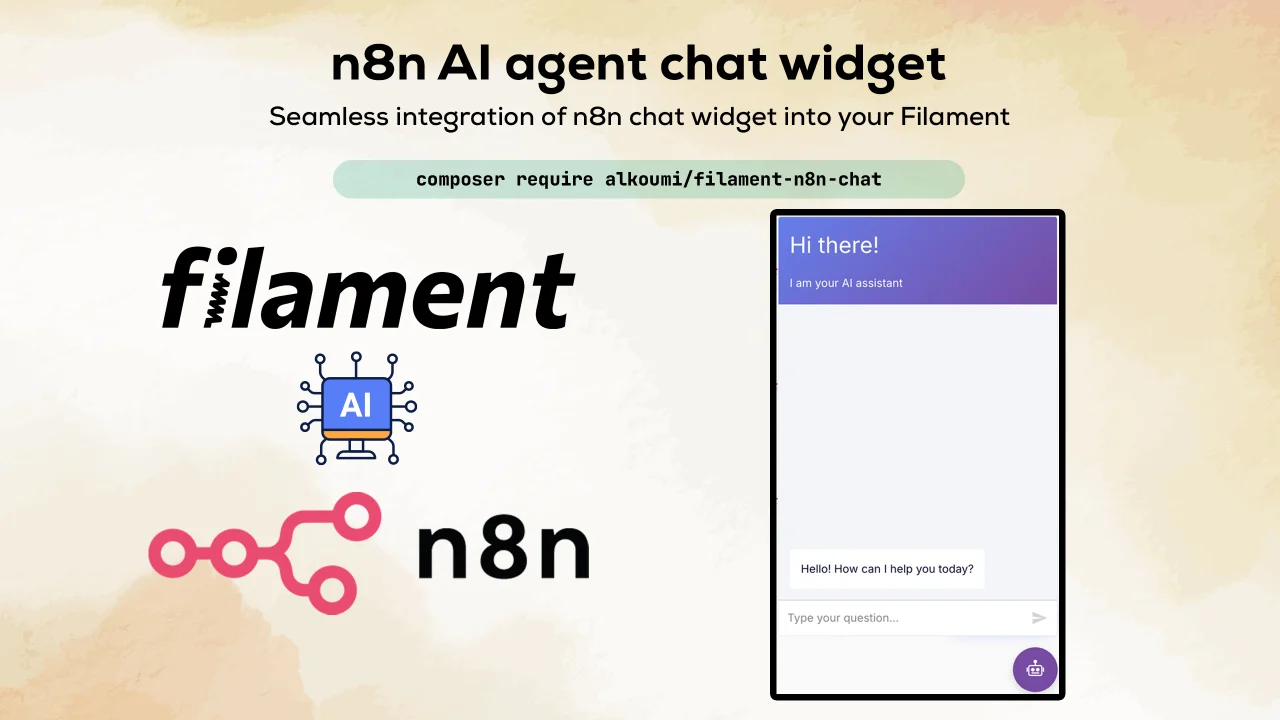
n8n chat
Seamless integration of n8n chat widget into your FilamentPHP applications with full multilingual support and theme customization.
Author:
Mohamed Alkoumi
Featured Plugins
A selection of plugins curated by the Filament team
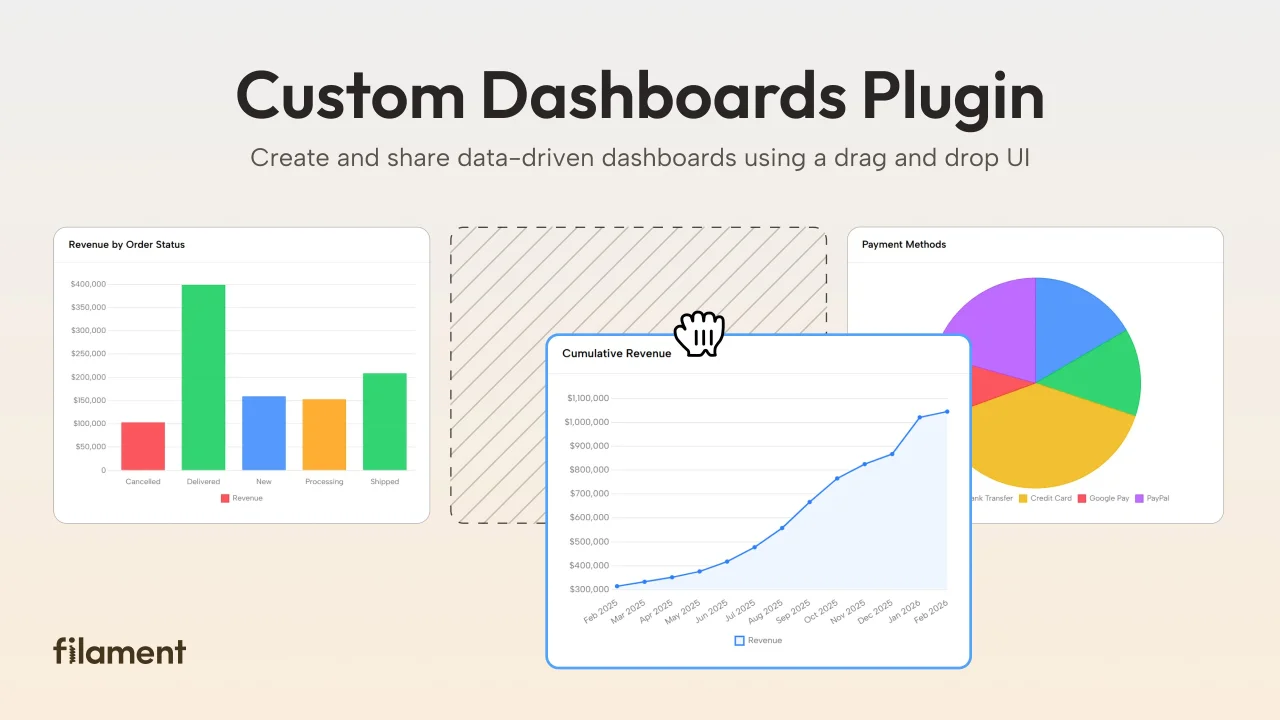
Custom Dashboards
Let your users build and share their own dashboards with a drag-and-drop interface. Define your data sources in PHP and let them do the rest.
 Filament
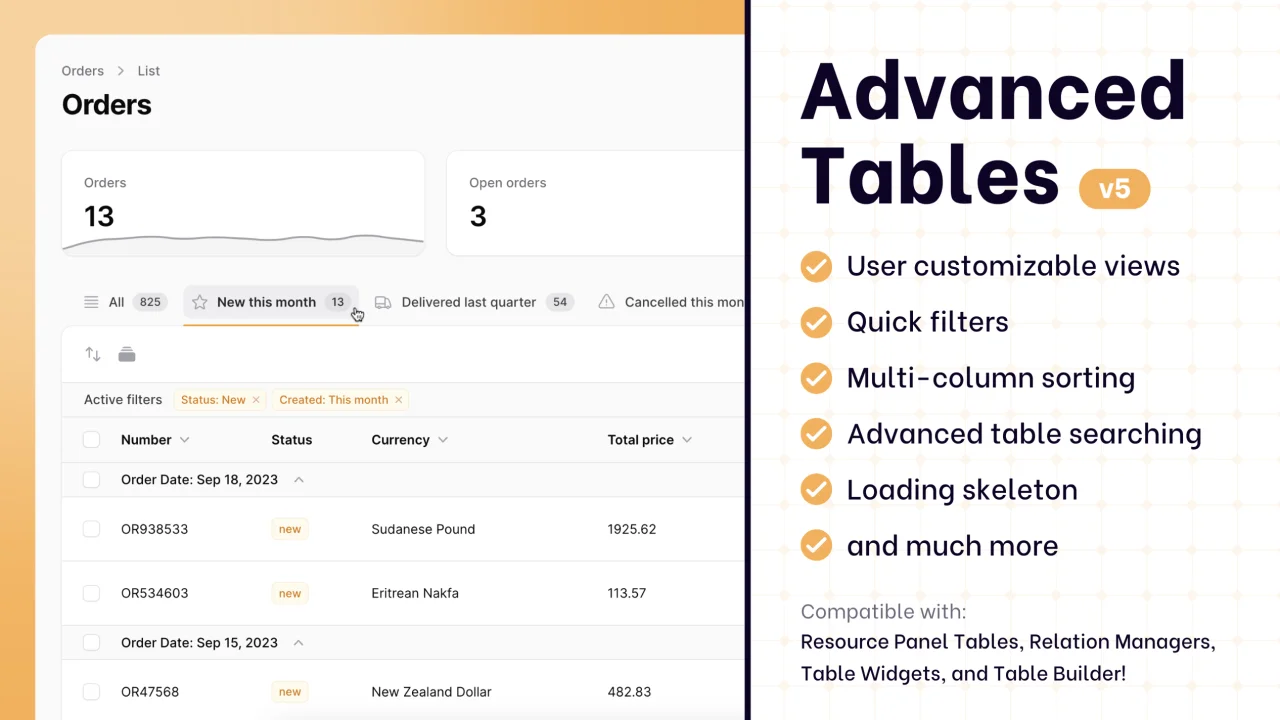
Advanced Tables (formerly Filter Sets)
Supercharge your tables with powerful features like user-customizable views, quick filters, multi-column sorting, advanced table searching, convenient view management, and more. Compatible with Resource Panel Tables, Relation Managers, Table Widgets, and Table Builder!
 Kenneth Sese
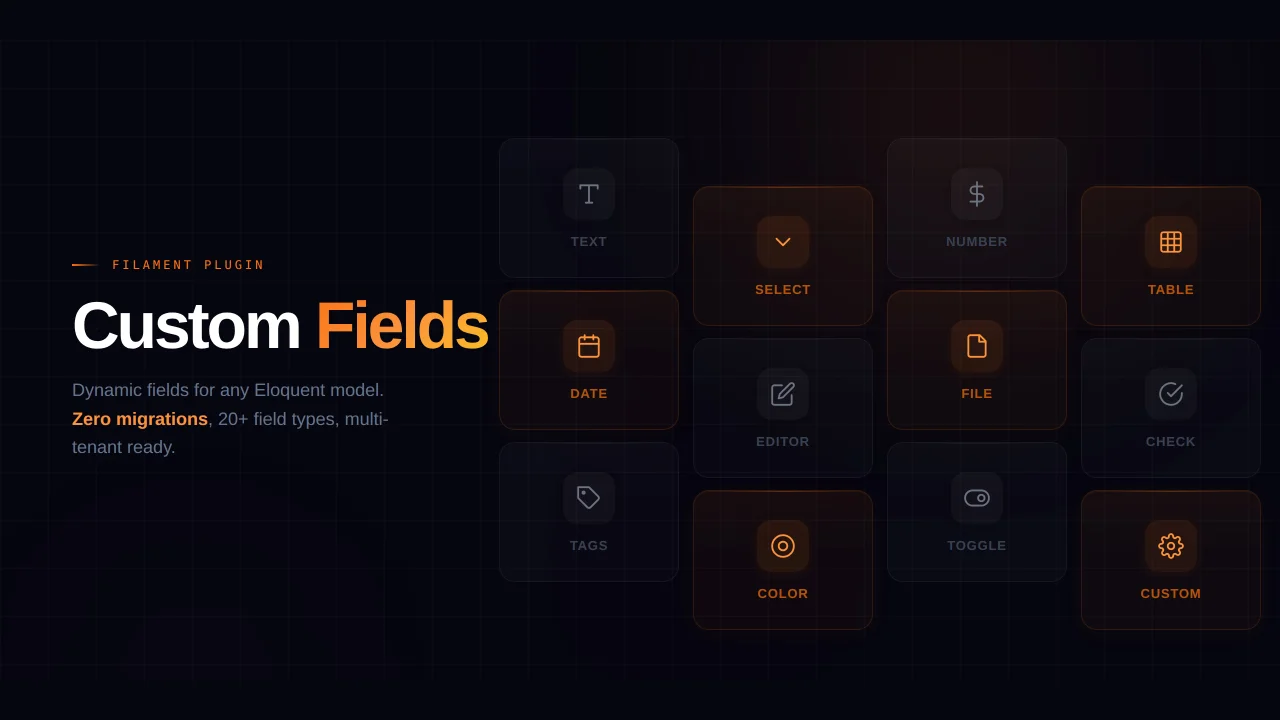
Custom Fields
Eliminate custom field migrations forever. Let your users create and manage form fields directly in Filament admin panels with 20+ built-in field types, validation, and zero database changes.
 Relaticle