Leaflet
A powerful integration of Leaflet maps with FilamentPHP, featuring interactive markers, GeoJSON support, and density visualization.
 Author:
Eduardo Ribeiro
Author:
Eduardo Ribeiro
Documentation
- Features
- Installation
- Table of Contents
- Core Components
- Map Elements
- User Interactions
- Advanced Features
- Best Practices
- Configuration Reference
- Color Reference
- Tile Layer Reference
- Value Objects Reference
- Concern Methods Reference
- License
- Credits
- Support
A powerful and elegant Leaflet integration for Filament PHP that makes creating interactive maps a breeze. Build beautiful, feature-rich maps with markers, clusters, shapes, and more using a fluent, expressive API.
#Features
- 🗺️ Interactive Maps - Full Leaflet integration with customizable tile layers
- 📍 Markers & Clusters - Beautiful markers with popup/tooltip support and intelligent clustering
- 🎨 Shapes - Circles, polygons, polylines, rectangles, and circle markers
- 🎯 Click Events - Handle clicks on markers, shapes, and the map itself
- 📊 GeoJSON Support - Display density maps with custom color schemes
- 🔄 Model Binding - Automatically create markers from Eloquent models
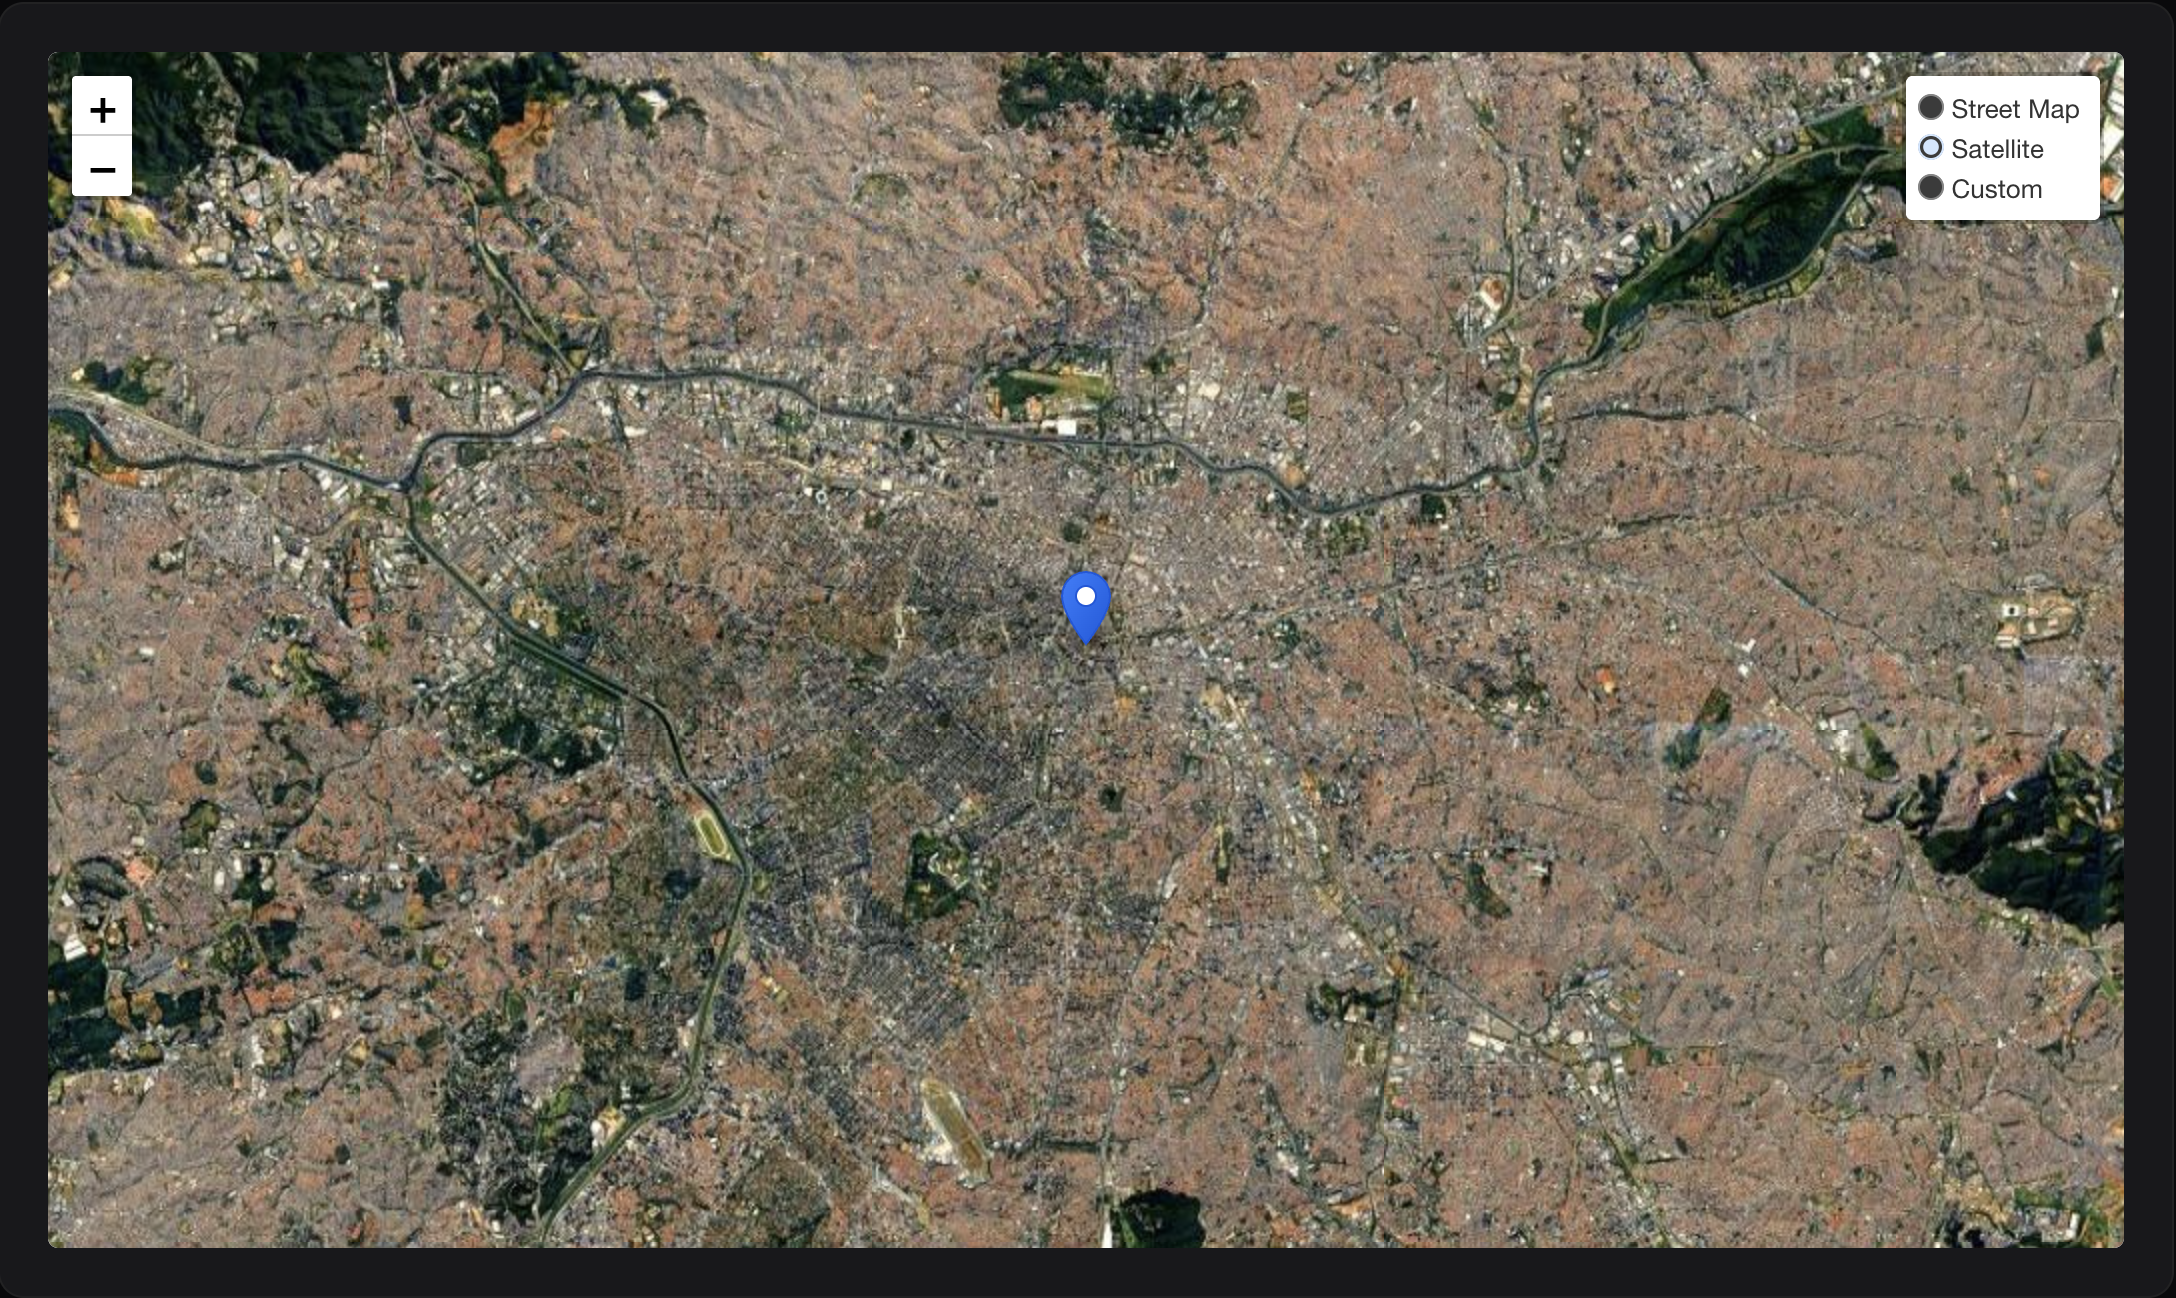
- 🎨 Multiple Tile Layers - Switch between OpenStreetMap, Satellite, and custom layers
- 💾 CRUD Operations - Create markers directly from map clicks
- 🎭 Customizable - Extensive configuration options for every element
#Latest Features
- Form Field (MapPicker) - Pick coordinates directly in forms with automatic latitude/longitude sync or JSON storage
- Table Column (MapColumn) - Display maps in Filament table columns for at-a-glance location visualization
- Infolist Entry (MapEntry) - Display read-only maps in Filament infolists
- Model GeoJSON Files - Automatic GeoJSON loading from models with
HasGeoJsonFiletrait - Layer Groups - Organize markers and shapes with automatic coverage area calculation
- Editable Layers & Draw Control - Edit markers and shapes directly on the map
- Dynamic Icons - Marker icons with automatic sizing and anchor point calculation
- Heroicon Support - Use Filament Heroicons directly in markers with automatic SVG rendering
- Enhanced Shapes - Factory methods (
fromRecord()) for all shape classes with support for JSON columns - JSON Storage - Store coordinates as JSON in single database column
- Map Interaction Control - Toggle dragging, zooming, and auto-recenter behavior
- Static Maps - Display read-only maps with automatic interaction disabling
- Auto-Recenter - Automatically recenter maps after users pan around
- Mapbox Tile Layer Support - New tile layer provider with configurable Access Token and tile size
- Marker CRUD Actions - Built-in view, edit, and delete actions for markers on the map
- Coordinate DTO - Improved handling of latitude/longitude pairs with dedicated DTO class
- GeoSearch Input Field - Geocoding search field with multiple provider support (Nominatim, Google Maps, Mapbox, Bing Maps)
- Address Value Object - Detailed address information from geocoding services
- Layer Architecture - Improved class hierarchy with
BaseLayer, proper type hints, and Livewire compatibility
#Installation
composer require eduardoribeirodev/filament-leaflet
Publish the assets:
php artisan vendor:publish --tag=filament-leaflet
This will publish the Leaflet assets used by the package.
#Table of Contents
- Installation
- Core Components
- Map Elements
- User Interactions
- Advanced Features
- Best Practices
- Configuration Reference
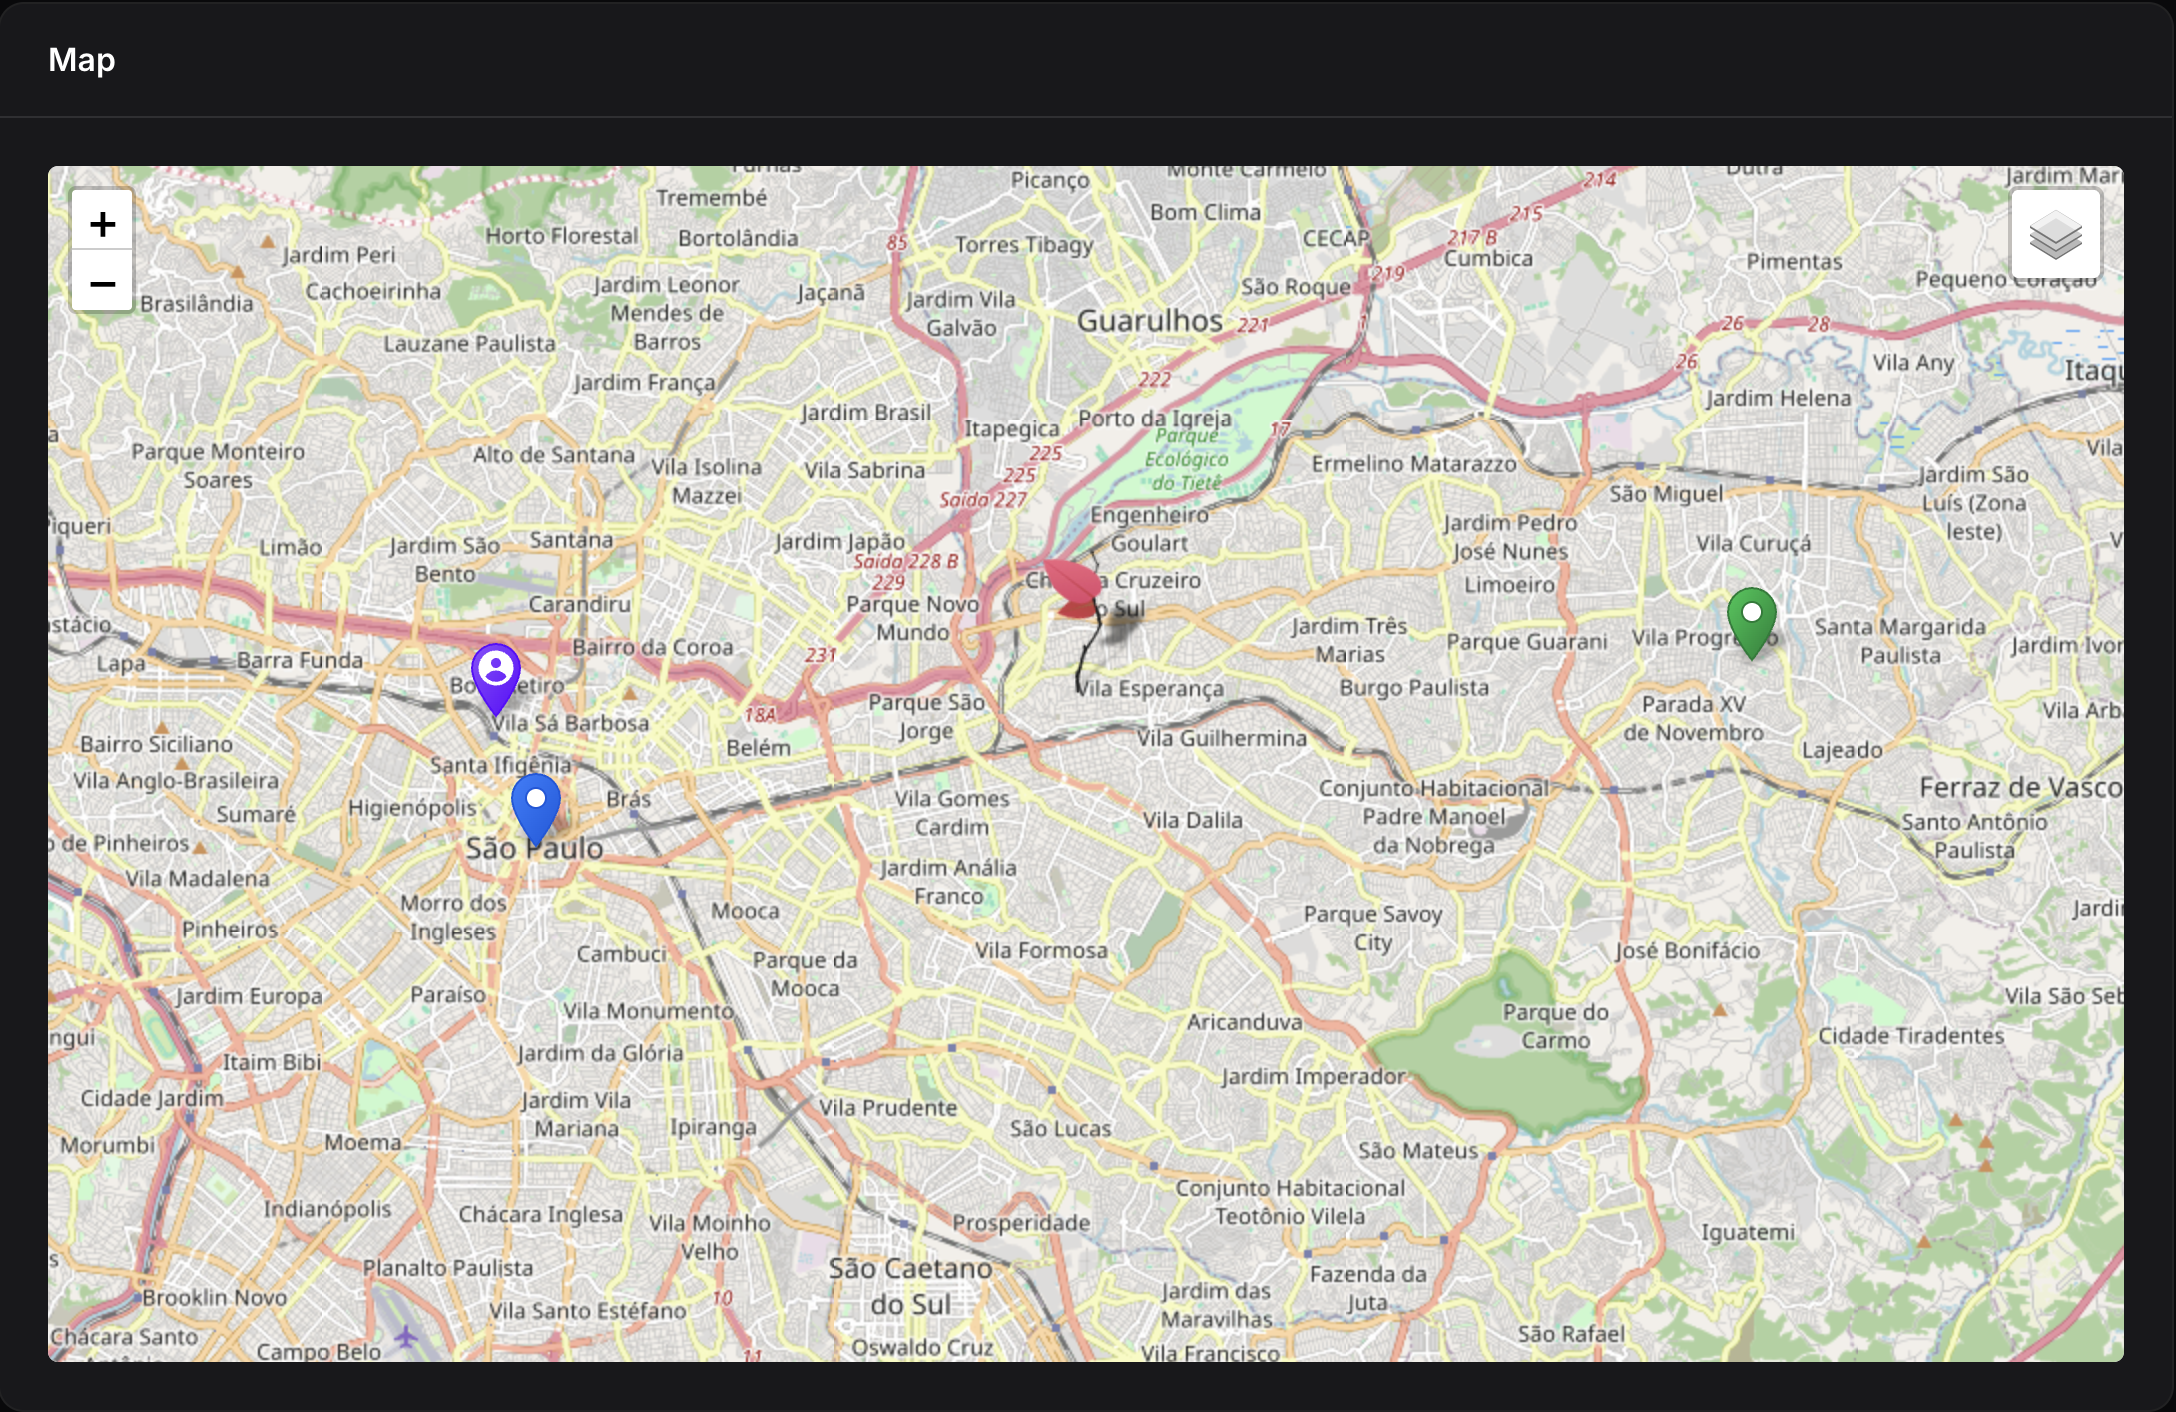
#Core Components
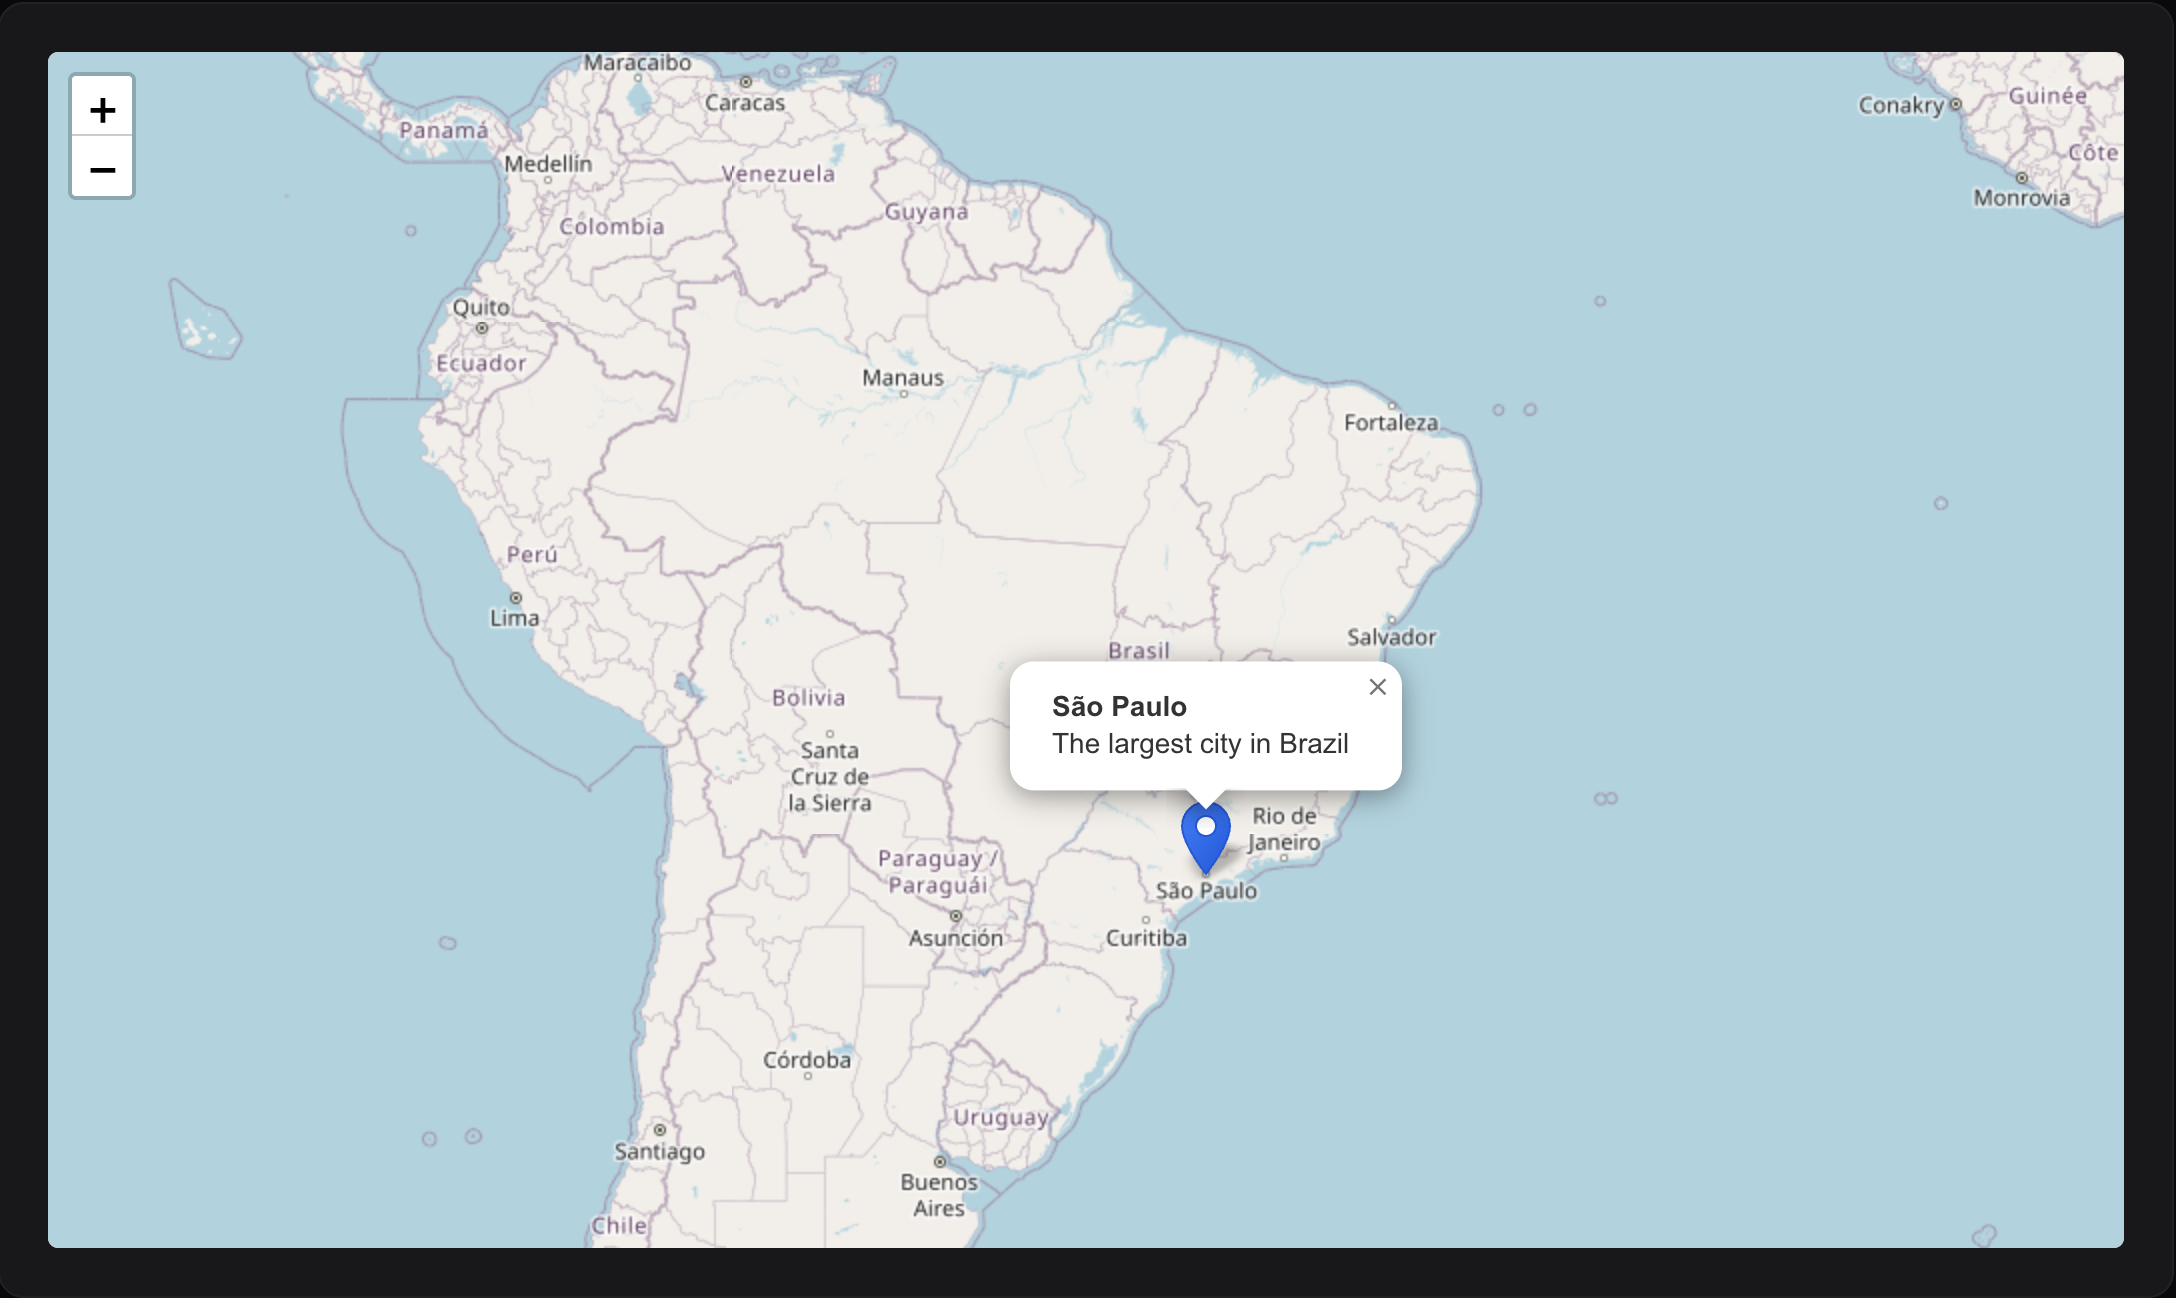
#Map Widget
Create your first interactive map widget:
namespace App\Filament\Widgets;
use EduardoRibeiroDev\FilamentLeaflet\Widgets\MapWidget;
use EduardoRibeiroDev\FilamentLeaflet\Layers\Marker;
class MyMapWidget extends MapWidget
{
protected ?string $heading = 'My Locations';
protected array $mapCenter = [-23.5505, -46.6333];
protected int $defaultZoom = 12;
protected int $mapHeight = 600;
protected function getMarkers(): array
{
return [
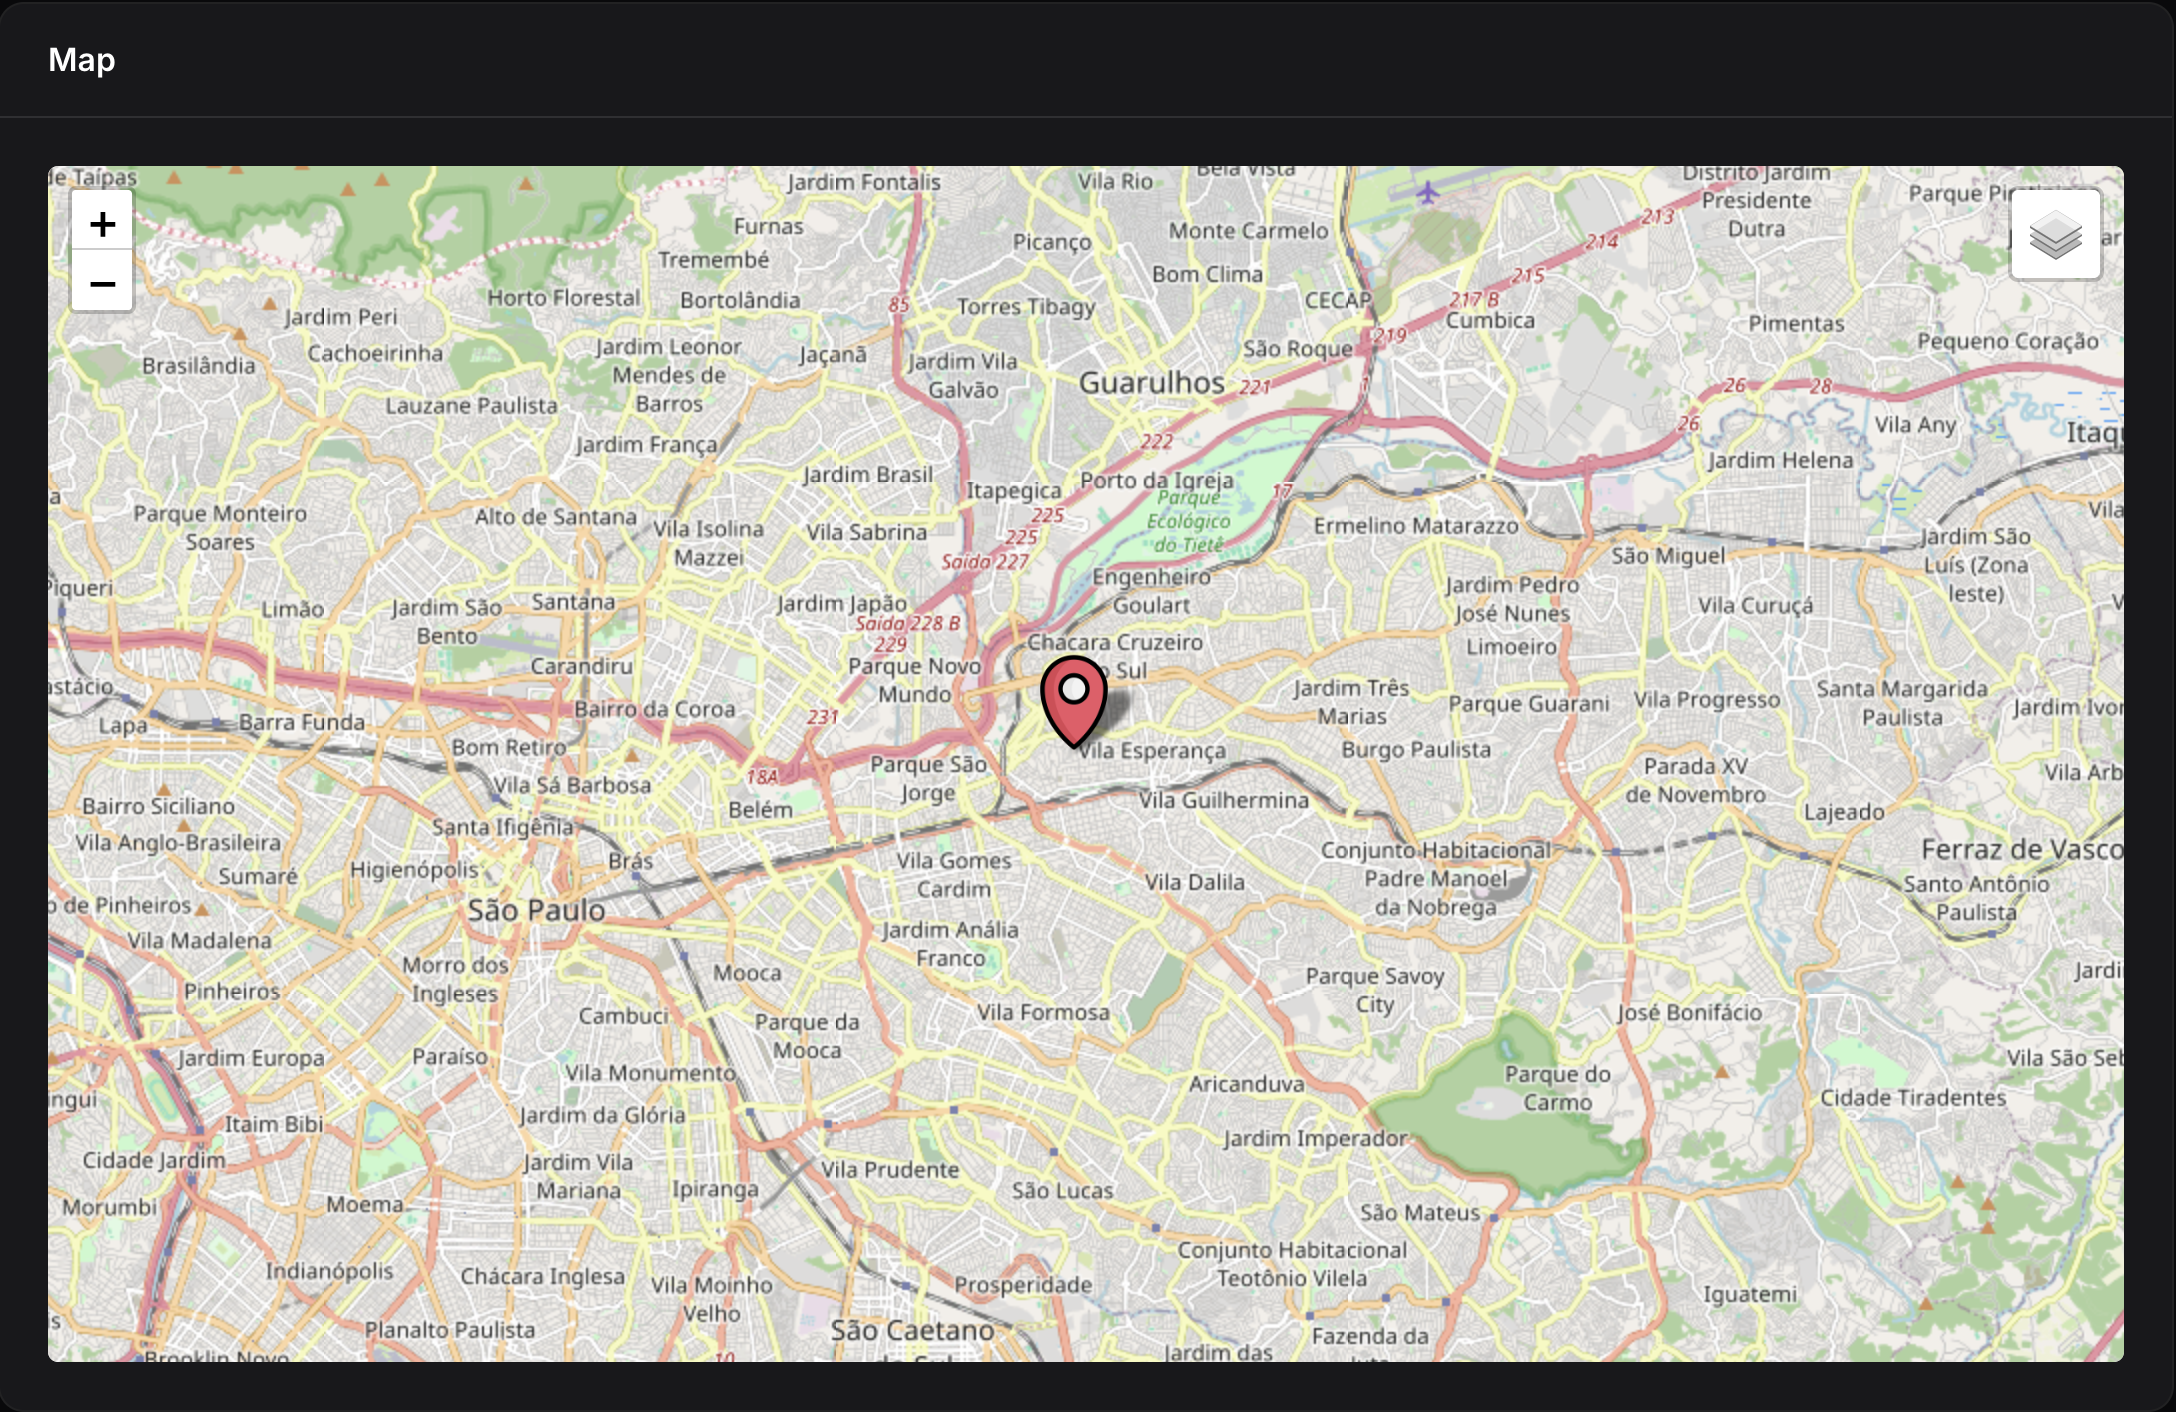
Marker::make(-23.5505, -46.6333)
->title('São Paulo')
->popupContent('The largest city in Brazil'),
];
}
}
#Basic Configuration
class MyMapWidget extends MapWidget
{
    // Display
    protected ?string $heading = 'Store Locations';
    protected int $mapHeight = 600;

    // Map center and zoom
    protected array $mapCenter = [-14.235, -51.9253];
    protected int $defaultZoom = 4;
    protected int $maxZoom = 18;
    protected int $minZoom = 2;
}
#Map Interaction Control
Control how users interact with your map:
class MyMapWidget extends MapWidget
{
    // Allow/prevent dragging
    protected bool $mapDraggable = true;

    // Allow/prevent zooming (scroll wheel, pinch)
    protected bool $mapZoomable = true;

    // Auto-recenter after user pans (in milliseconds)
    // Set to null to disable
    protected ?int $recenterMapTimeout = 5000;  // Recenter after 5 seconds

    // Auto-center to user's current location
    protected bool $autoCenter = false;
}
Static Maps - Disable all interactions:
MapPicker::make('location')
    ->static()  // Equivalent to ->mapDraggable(false)->mapZoomable(false)
#Controls
Enable/disable map controls:
class MyMapWidget extends MapWidget
{
    protected bool $hasAttributionControl = true;
    protected bool $hasScaleControl = true;
    protected bool $hasZoomControl = true;
    protected bool $hasFullscreenControl = true;
    protected bool $hasSearchControl = true;

    protected bool $hasDrawMarkerControl = true;
    protected bool $hasDrawCircleMarkerControl = true;
    protected bool $hasDrawCircleControl = true;
    protected bool $hasDrawPolylineControl = true;
    protected bool $hasDrawRectangleControl = true;
    protected bool $hasDrawPolygonControl = true;
    protected bool $hasDrawTextControl = true;
    protected bool $hasEditLayersControl = true;
    protected bool $hasDragLayersControl = true;
    protected bool $hasRemoveLayersControl = true;
    protected bool $hasRotateLayersControl = true;
    protected bool $hasCutPolygonControl = true;
}
Conditionally show controls at runtime:
protected function hasDrawCircleControl(): bool
{
    return auth()?->user()?->is_admin;
}
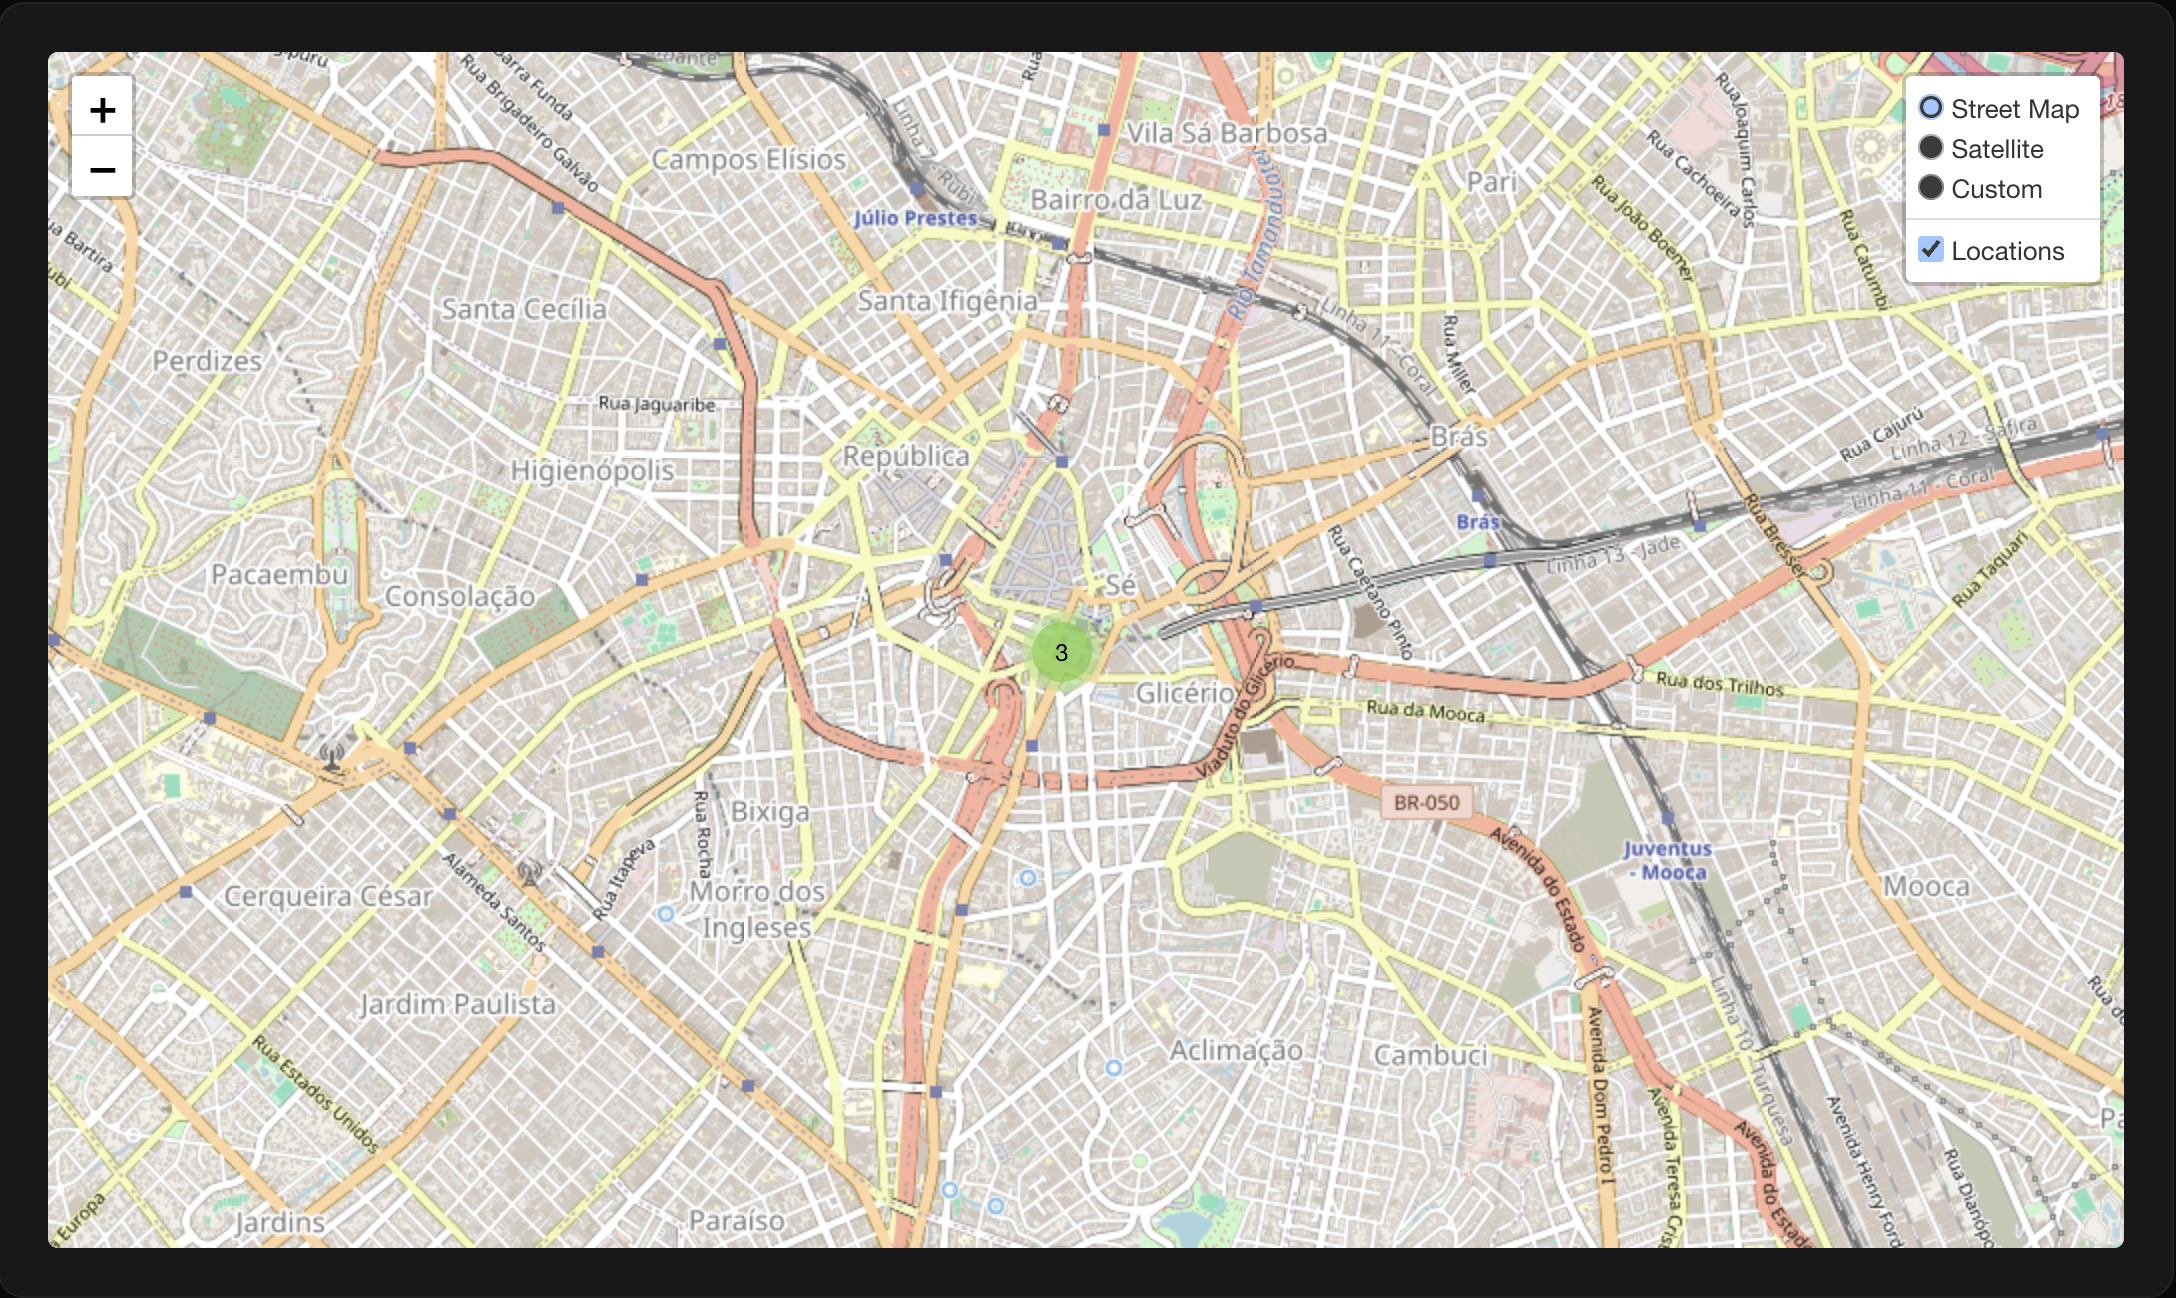
#Tile Layers
Choose from multiple providers or add custom layers:
use EduardoRibeiroDev\FilamentLeaflet\Enums\TileLayer;

class MyMapWidget extends MapWidget
{
    // Single layer
    protected TileLayer|string|array $tileLayersUrl = TileLayer::OpenStreetMap;

    // Multiple layers
    protected TileLayer|string|array $tileLayersUrl = [
        'Street Map' => TileLayer::OpenStreetMap,
        'Satellite' => TileLayer::GoogleSatellite,
        'Custom' => 'https://{s}.tile.custom.com/{z}/{x}/{y}.png',
    ];
}
#Configuration
You can configure default values for the package in config/filament-leaflet.php:
return [

    'columns' => [ // Default column names for model binding (can be overridden in fromRecord() methods)
        'latitude' => 'lat',
        'longitude' => 'lng',
        'coords' => 'location',
        'radius' => 'radius',
        'title' => 'title',
        'description' => 'description',
        'bounds' => 'bounds',
        'points' => 'points',
    ],
    'sync_record_attributes' => true, // Auto-sync changes back to models
    'default_map_center' => [-14.235, -51.9253], // Default map center
];
Publish the configuration file:
php artisan vendor:publish --tag=filament-leaflet-config
Available providers: OpenStreetMap, GoogleStreets, GoogleSatellite, GoogleHybrid, GoogleTerrain, EsriWorldImagery, EsriWorldStreetMap, EsriNatGeo, CartoPositron, CartoDarkMatter, Mapbox
Mapbox Tile Layer:
To use Mapbox tiles, configure your access token in .env or config/services.php:
Environment variables:
MAPBOX_ACCESS_TOKEN=your_mapbox_access_token_here
MAPBOX_TILE_SIZE=512
Or in config/services.php:
'mapbox' => [
    'token' => env('MAPBOX_ACCESS_TOKEN'),
    'tile_size' => env('MAPBOX_TILE_SIZE', 512),
],
Then use the Mapbox tile layer in your widget:
use EduardoRibeiroDev\FilamentLeaflet\Enums\TileLayer;

class MyMapWidget extends MapWidget
{
    // Single Mapbox layer
    protected TileLayer|string|array $tileLayersUrl = TileLayer::MapboxStreets;
}
Available Mapbox providers:
TileLayer::MapboxStreets- Streets layerTileLayer::MapboxOutdoors- Outdoors layerTileLayer::MapboxLight- Light layerTileLayer::MapboxDark- Dark layerTileLayer::MapboxSatellite- Satellite layer
Or use multiple Mapbox layers:
protected TileLayer|string|array $tileLayersUrl = [
    'Street Map' => TileLayer::OpenStreetMap,
    'Mapbox Streets' => TileLayer::MapboxStreets,
    'Mapbox Satellite' => TileLayer::MapboxSatellite,
    'Mapbox Outdoors' => TileLayer::MapboxOutdoors,
];
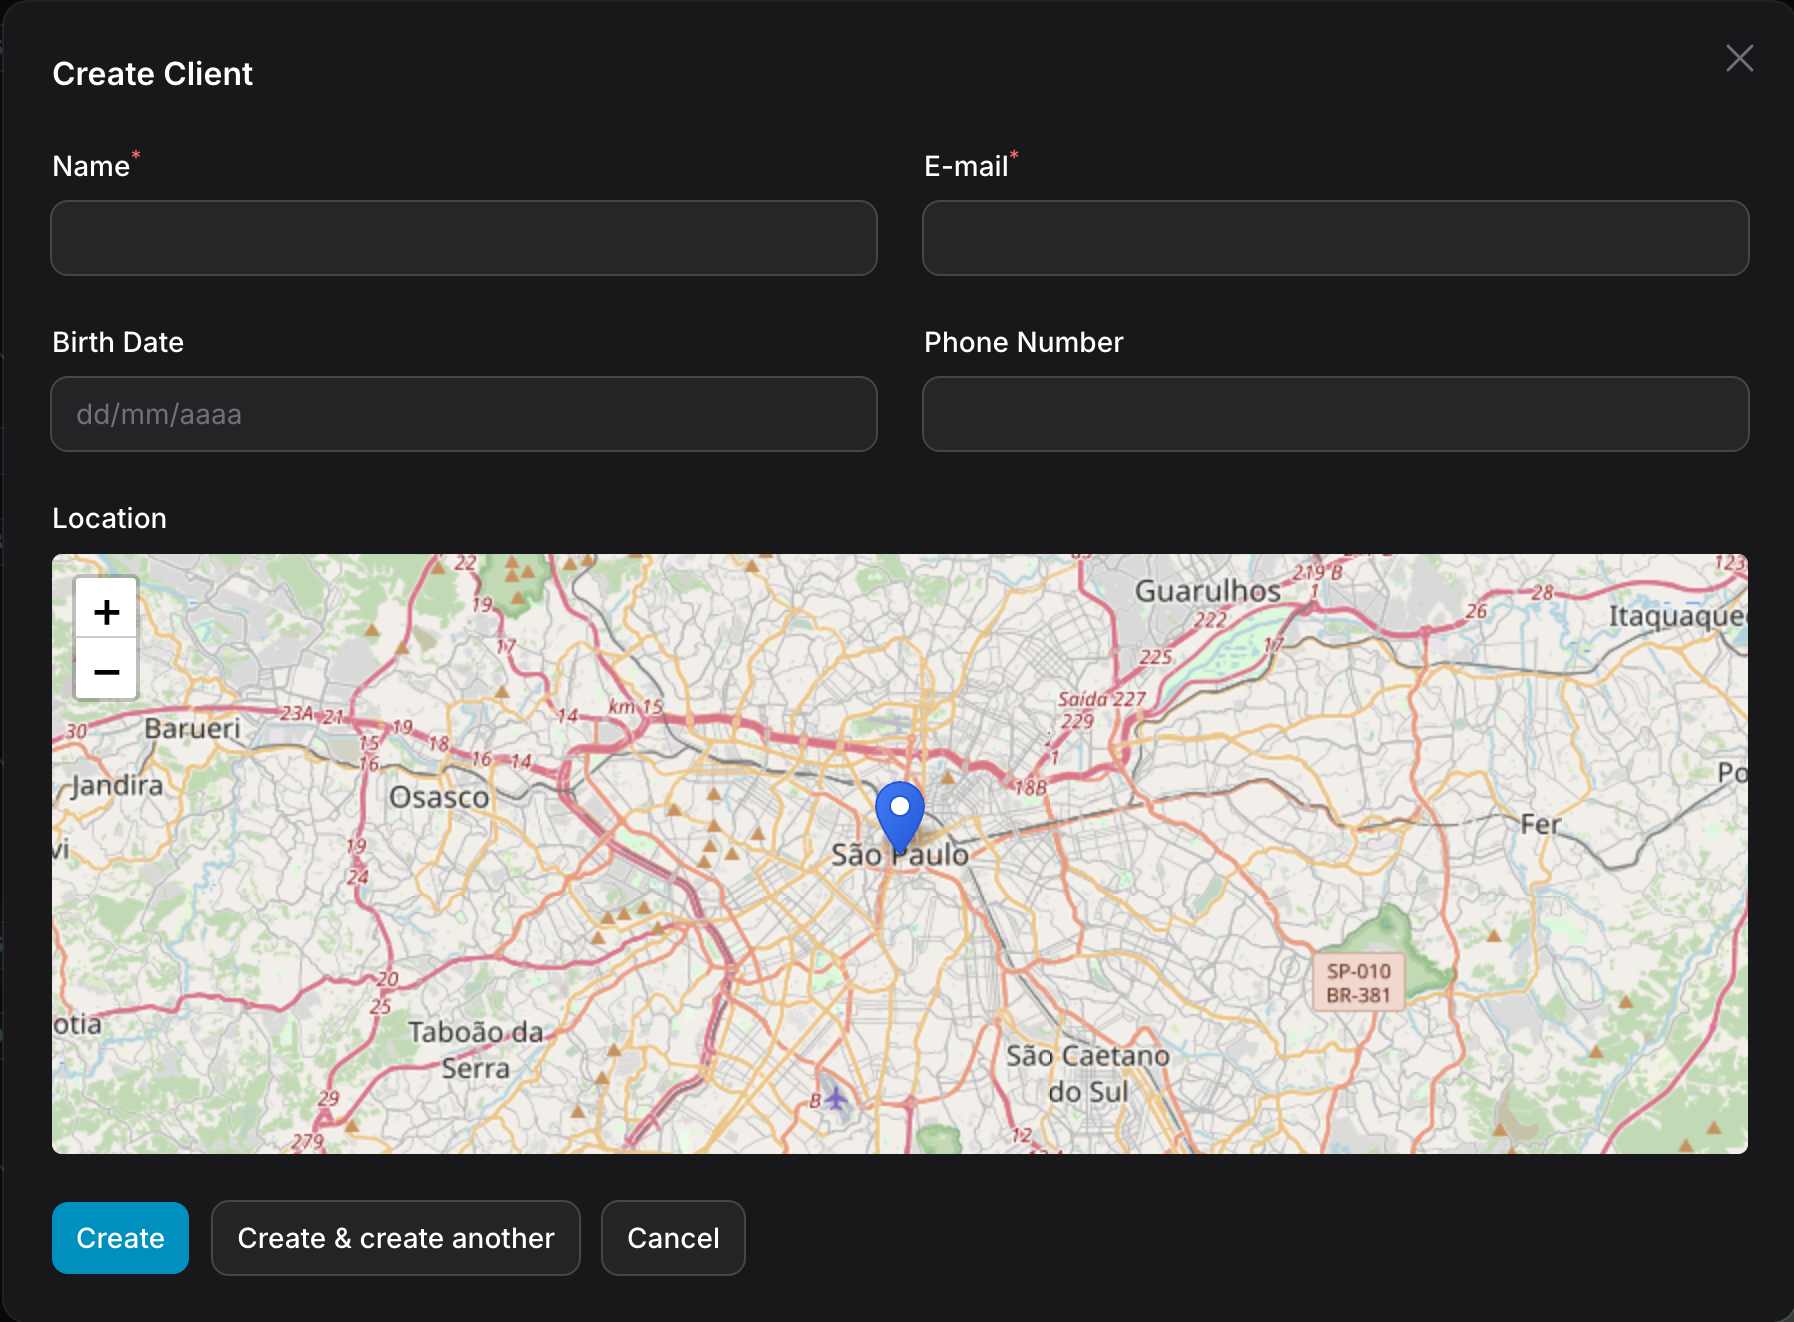
#MapPicker (Form Field)
Add an interactive map inside Filament forms. It syncs map clicks to form fields and supports all MapWidget configuration methods.
use EduardoRibeiroDev\FilamentLeaflet\Fields\MapPicker;
use EduardoRibeiroDev\FilamentLeaflet\Enums\TileLayer;

MapPicker::make('location')
    ->height(300)
    ->center(-23.5505, -46.6333)
    ->zoom(11)
    ->autoCenter()  // Auto-center to user's location
    ->tileLayersUrl(TileLayer::OpenStreetMap)
    ->columnSpanFull()
Load GeoJSON: Automatically loads from models with HasGeoJsonFile trait or getGeoJsonUrl() method:
use EduardoRibeiroDev\FilamentLeaflet\Concerns\HasGeoJsonFile;

class DeliveryZone extends Model
{
    use HasGeoJsonFile;

    public function getGeoJsonFileAttributeName(): string
    {
        return 'geojson_file';
    }

    public function getGeoJsonFileDisk(): ?string
    {
        return 's3';
    }

    public function getExpirationTime(): ?DateTime
    {
        return now()->addHour();
    }
}
Customize pick marker: Visual feedback when clicking the map:
MapPicker::make('location')
    ->pickMarker(fn(Marker $marker) => $marker->blue()->title('Selected'))
Dynamic configuration: Most methods accept closures:
MapPicker::make('location')
    ->center(fn() => [$lat, $lng])
    ->height(fn($record) => 300)
    ->zoom(fn($record) => $record->zoom_level)
    ->mapDraggable(fn($record) => $record->is_editable)
    ->recenterTimeout(fn($record) => $record->is_read_only ? 3000 : null)
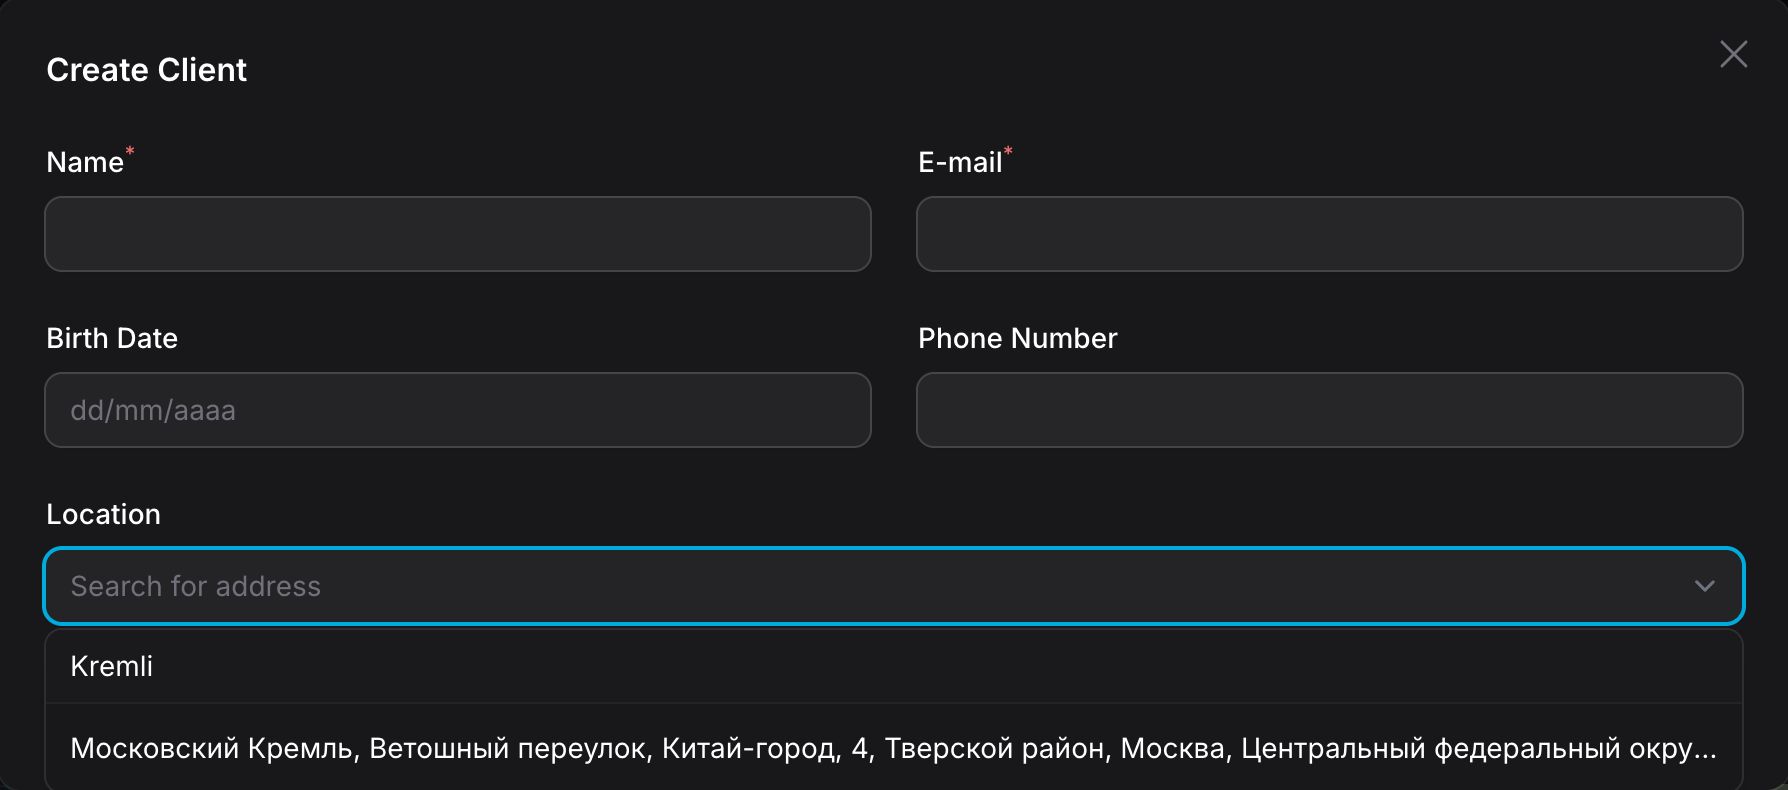
#GeoSearchInput (Form Field)
Search and select locations using multiple geocoding providers:
use EduardoRibeiroDev\FilamentLeaflet\Fields\GeoSearchInput;
use EduardoRibeiroDev\FilamentLeaflet\Enums\GeoSearchProvider;

GeoSearchInput::make('location')
    ->provider(GeoSearchProvider::Nominatim)  // Uses OpenStreetMap
    ->limit(10)                               // Max 10 results
    ->withAddressDetails()                    // Include structured address data
    ->language('ru')                          // Preferred language
    ->countryCodes('ru')                      // Restrict to Russia
    ->cacheResults(3600)                      // Cache for 1 hour
    ->textMode(false)                         // Stores full address instead of  coordinates
    ->columnSpanFull()
Supported Providers:
Nominatim(OpenStreetMap) - Free, no API key requiredGoogleMaps- RequiresGOOGLE_MAPS_API_KEYenvironment variableMapbox- RequiresMAPBOX_API_KEYenvironment variableBingMaps- RequiresBING_MAPS_API_KEYenvironment variable
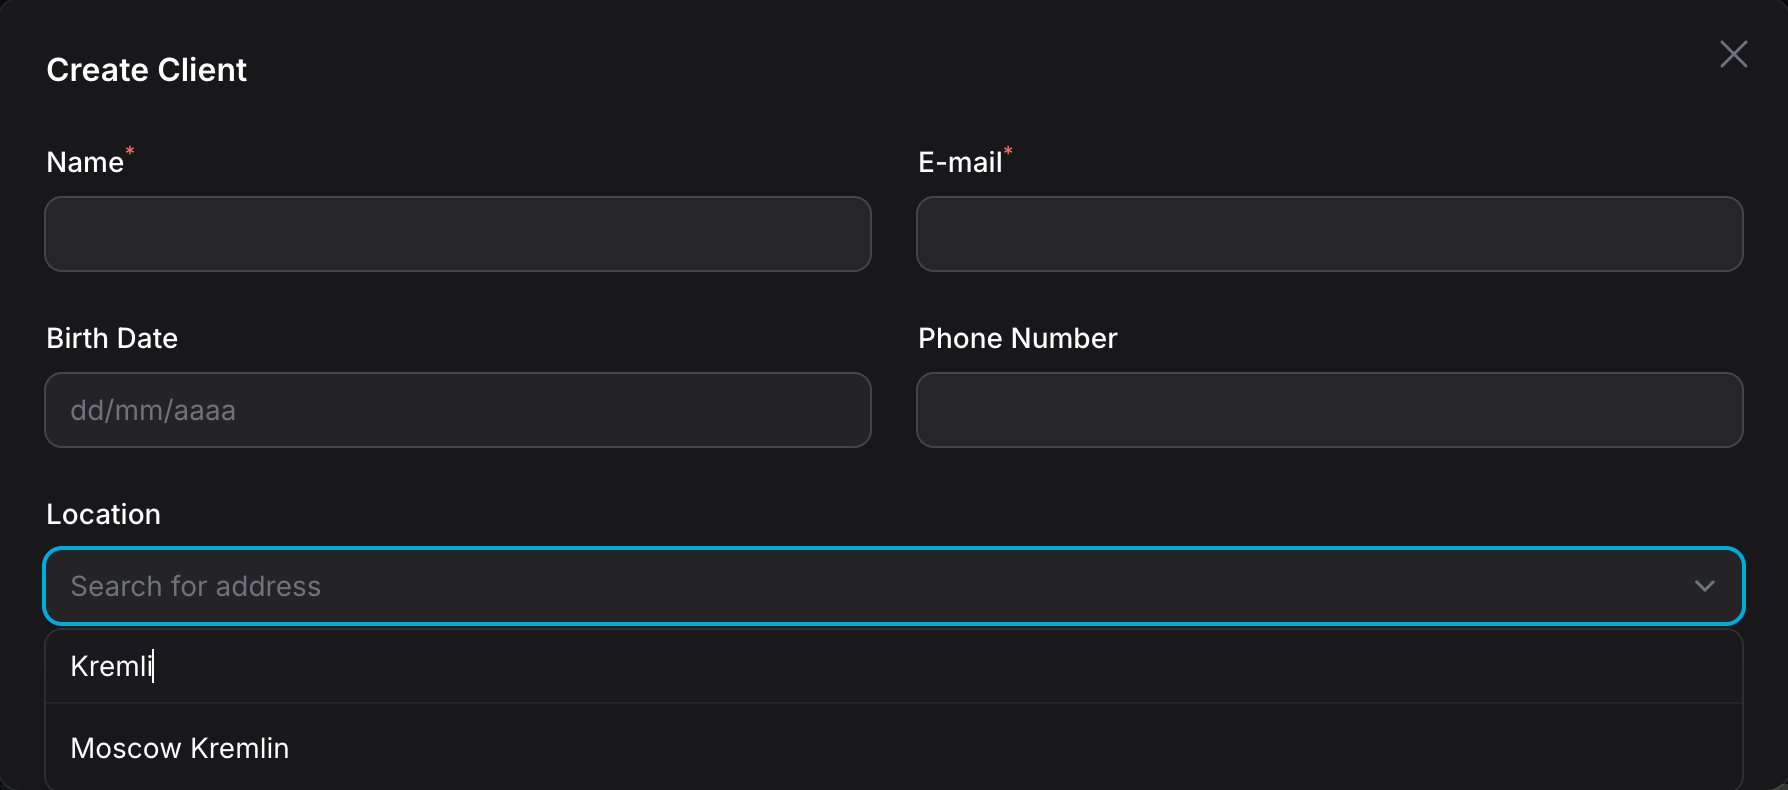
Advanced Configuration:
// Restrict results to a geographic bounding box
GeoSearchInput::make('location')
    ->provider(GeoSearchProvider::Nominatim)
    ->viewbox(
        minLon: 19.0,   // West
        minLat: 41.0,   // South
        maxLon: 190.0,  // East
        maxLat: 82.0    // North
    )
    ->bounded(true)  // Strictly restrict to viewbox
    ->minSearchLength(3)  // Don't search until user types 3+ chars
    ->useShortLabels(true)  // "Moscow Kremlin" instead of full address
Form Model Integration:
The field returns a GeoSearchResult object containing:
coordinate- The selected location's latitude/longitudename- Short place namedisplayName- Full addressaddress- Structured address with country, city, postcode, etc.type- Location type (building, street, city, etc.)addresstype- More specific type (e.g. "tourism", "shop", "amenity")boundingbox- Geographic bounds of the location
use EduardoRibeiroDev\FilamentLeaflet\Fields\GeoSearchInput;
use EduardoRibeiroDev\FilamentLeaflet\ValueObjects\GeoSearchResult;

GeoSearchInput::make('location')->afterStateUpdated(function (callable $set, GeoSearchResult $state) {
    // Access the selected location's data
    $coordinate = $result->coordinate;  // Coordinate object with lat/lng
    $name = $result->name;              // Short name (e.g. "Eiffel Tower")
    $displayName = $result->displayName; // Full address
    $address = $result->address;        // Structured address data
    $type = $result->type;              // Location type (e.g. "tourism")
    $addresstype = $result->addresstype; // More specific type (e.g. "tourism", "shop", "amenity")

    // Example: Set a separate fields
    $set('full_address', $displayName);
    $set('city', $address->city);
    $set('country', $address->country);
    $set('type', $type);
    $set('addresstype', $addresstype);
})
Address Components:
The Address object provides structured address data:
$address = $result->address;

$address->country;       // "Brazil"
$address->countryCode;   // "BR"
$address->state;         // "São Paulo"
$address->city;          // "São Paulo"
$address->county;        // County name
$address->postcode;      // Postal code
$address->suburb;        // Suburb/neighborhood
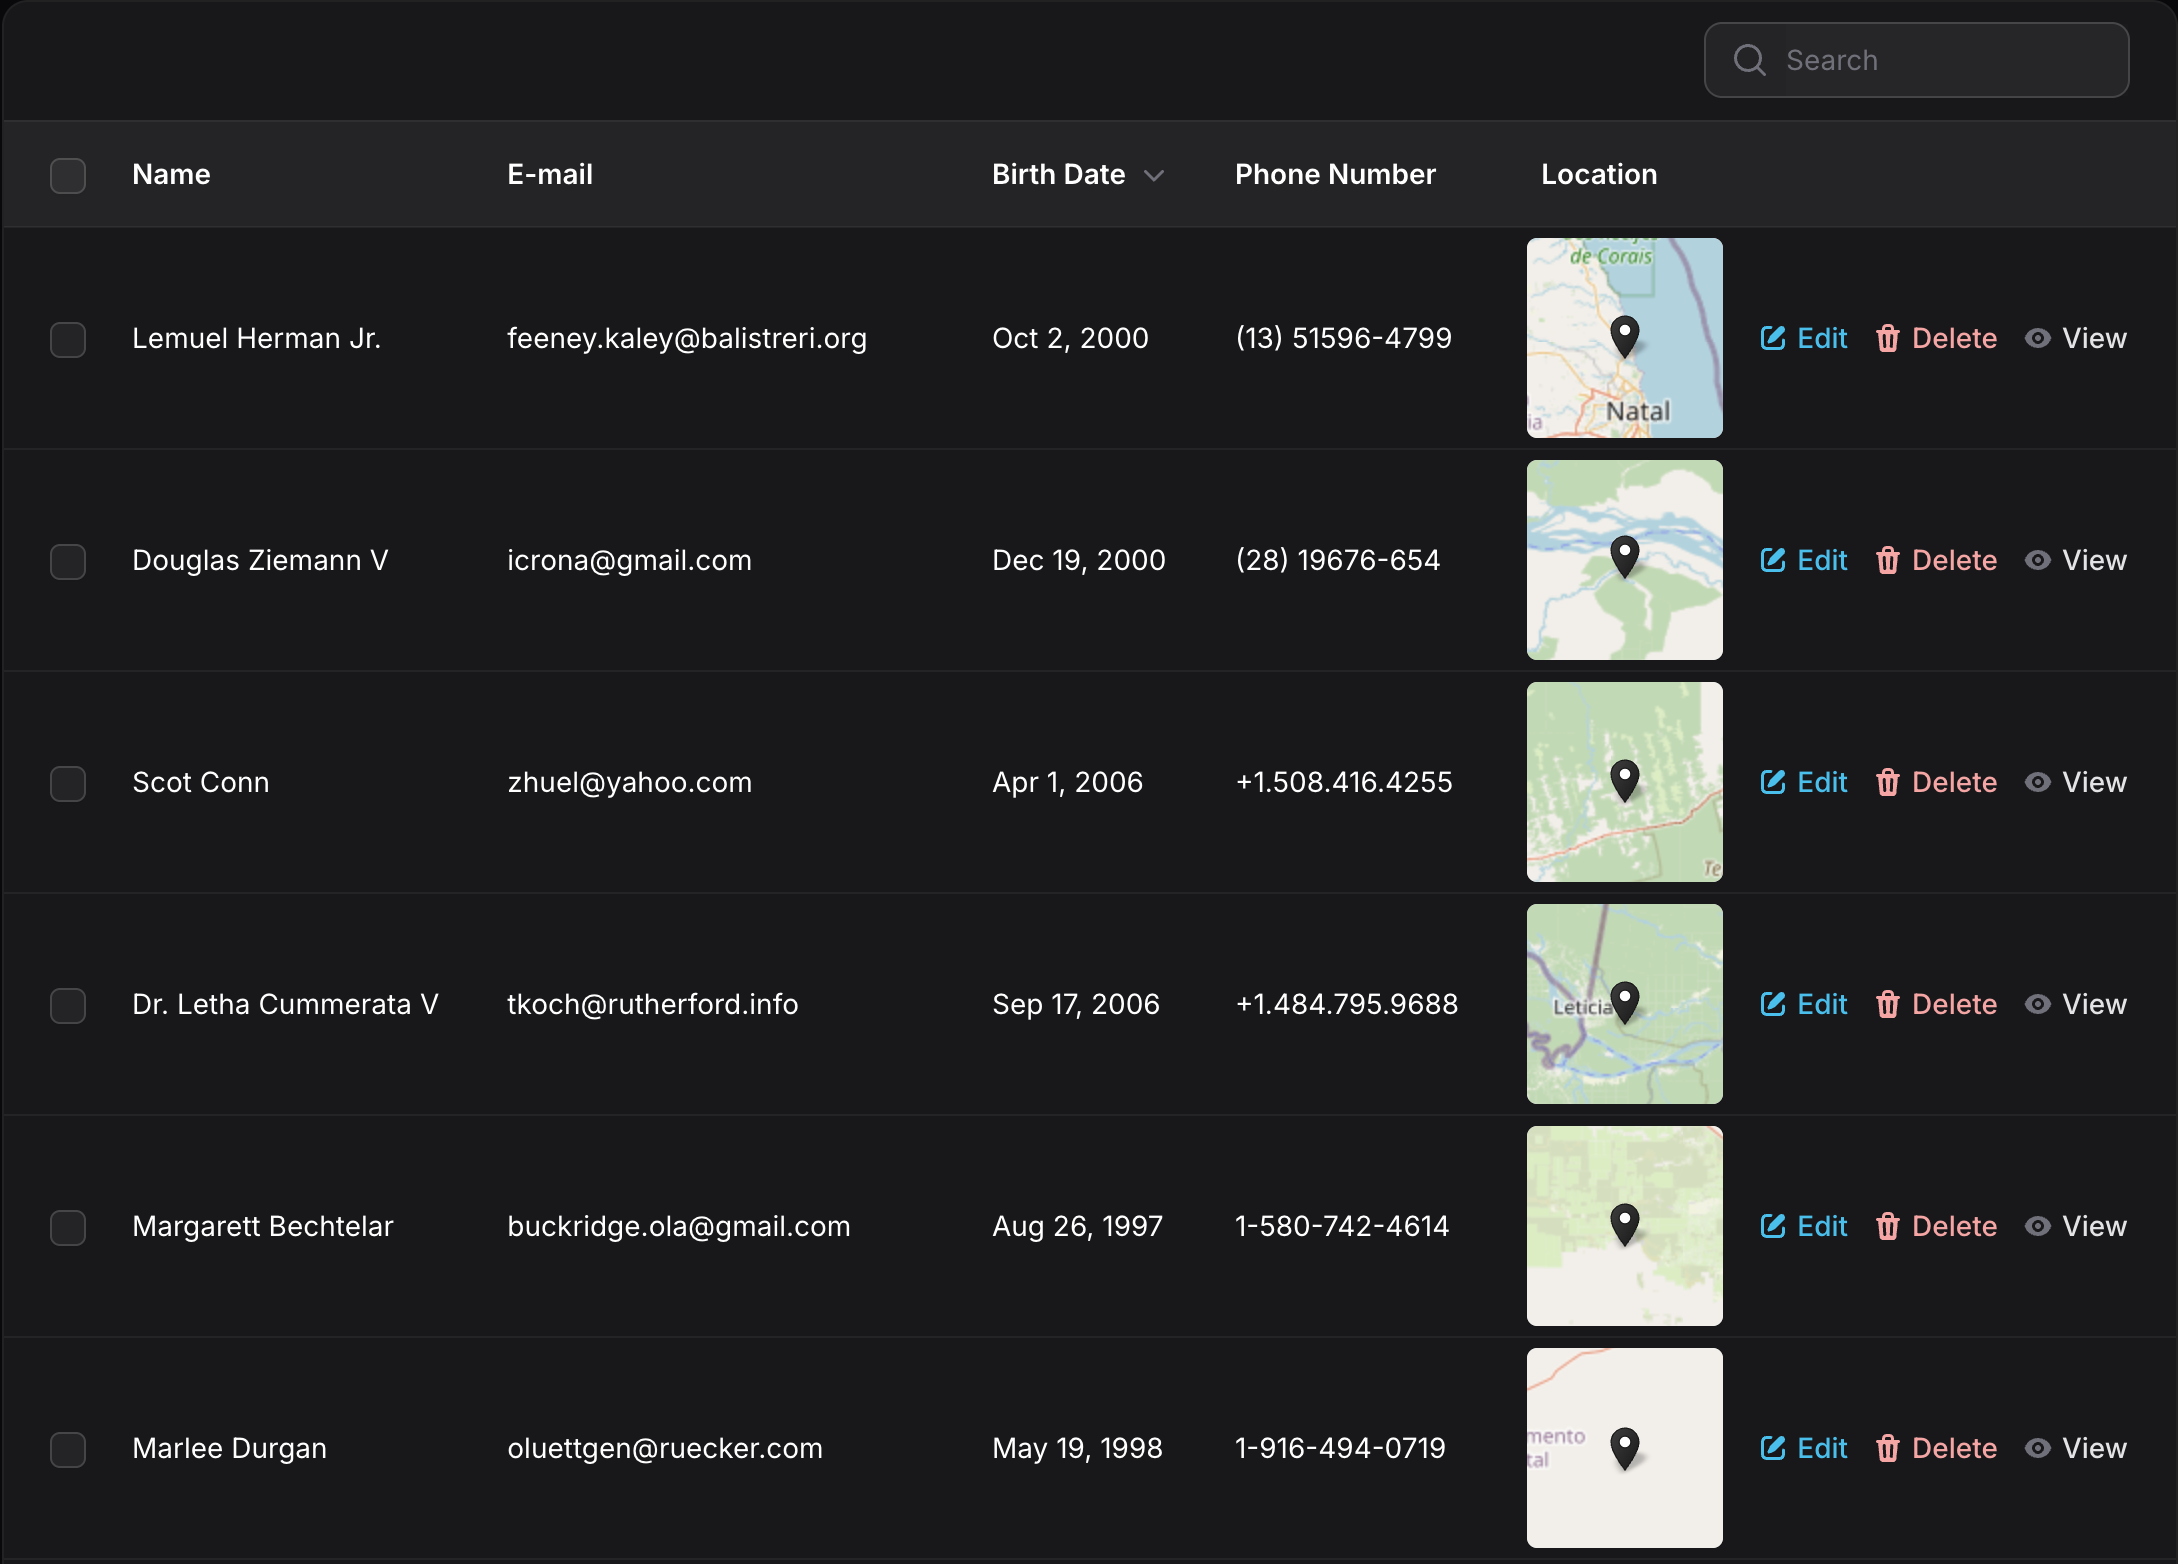
#MapColumn (Table Column)
Display maps directly in Filament table columns:
use EduardoRibeiroDev\FilamentLeaflet\Tables\MapColumn;
use EduardoRibeiroDev\FilamentLeaflet\Layers\Marker;

MapColumn::make('location')
    ->height(100)
    ->zoom(8)
    ->pickMarker(fn(Marker $marker) => $marker->black())
    ->static()    // Disable interactions in table preview
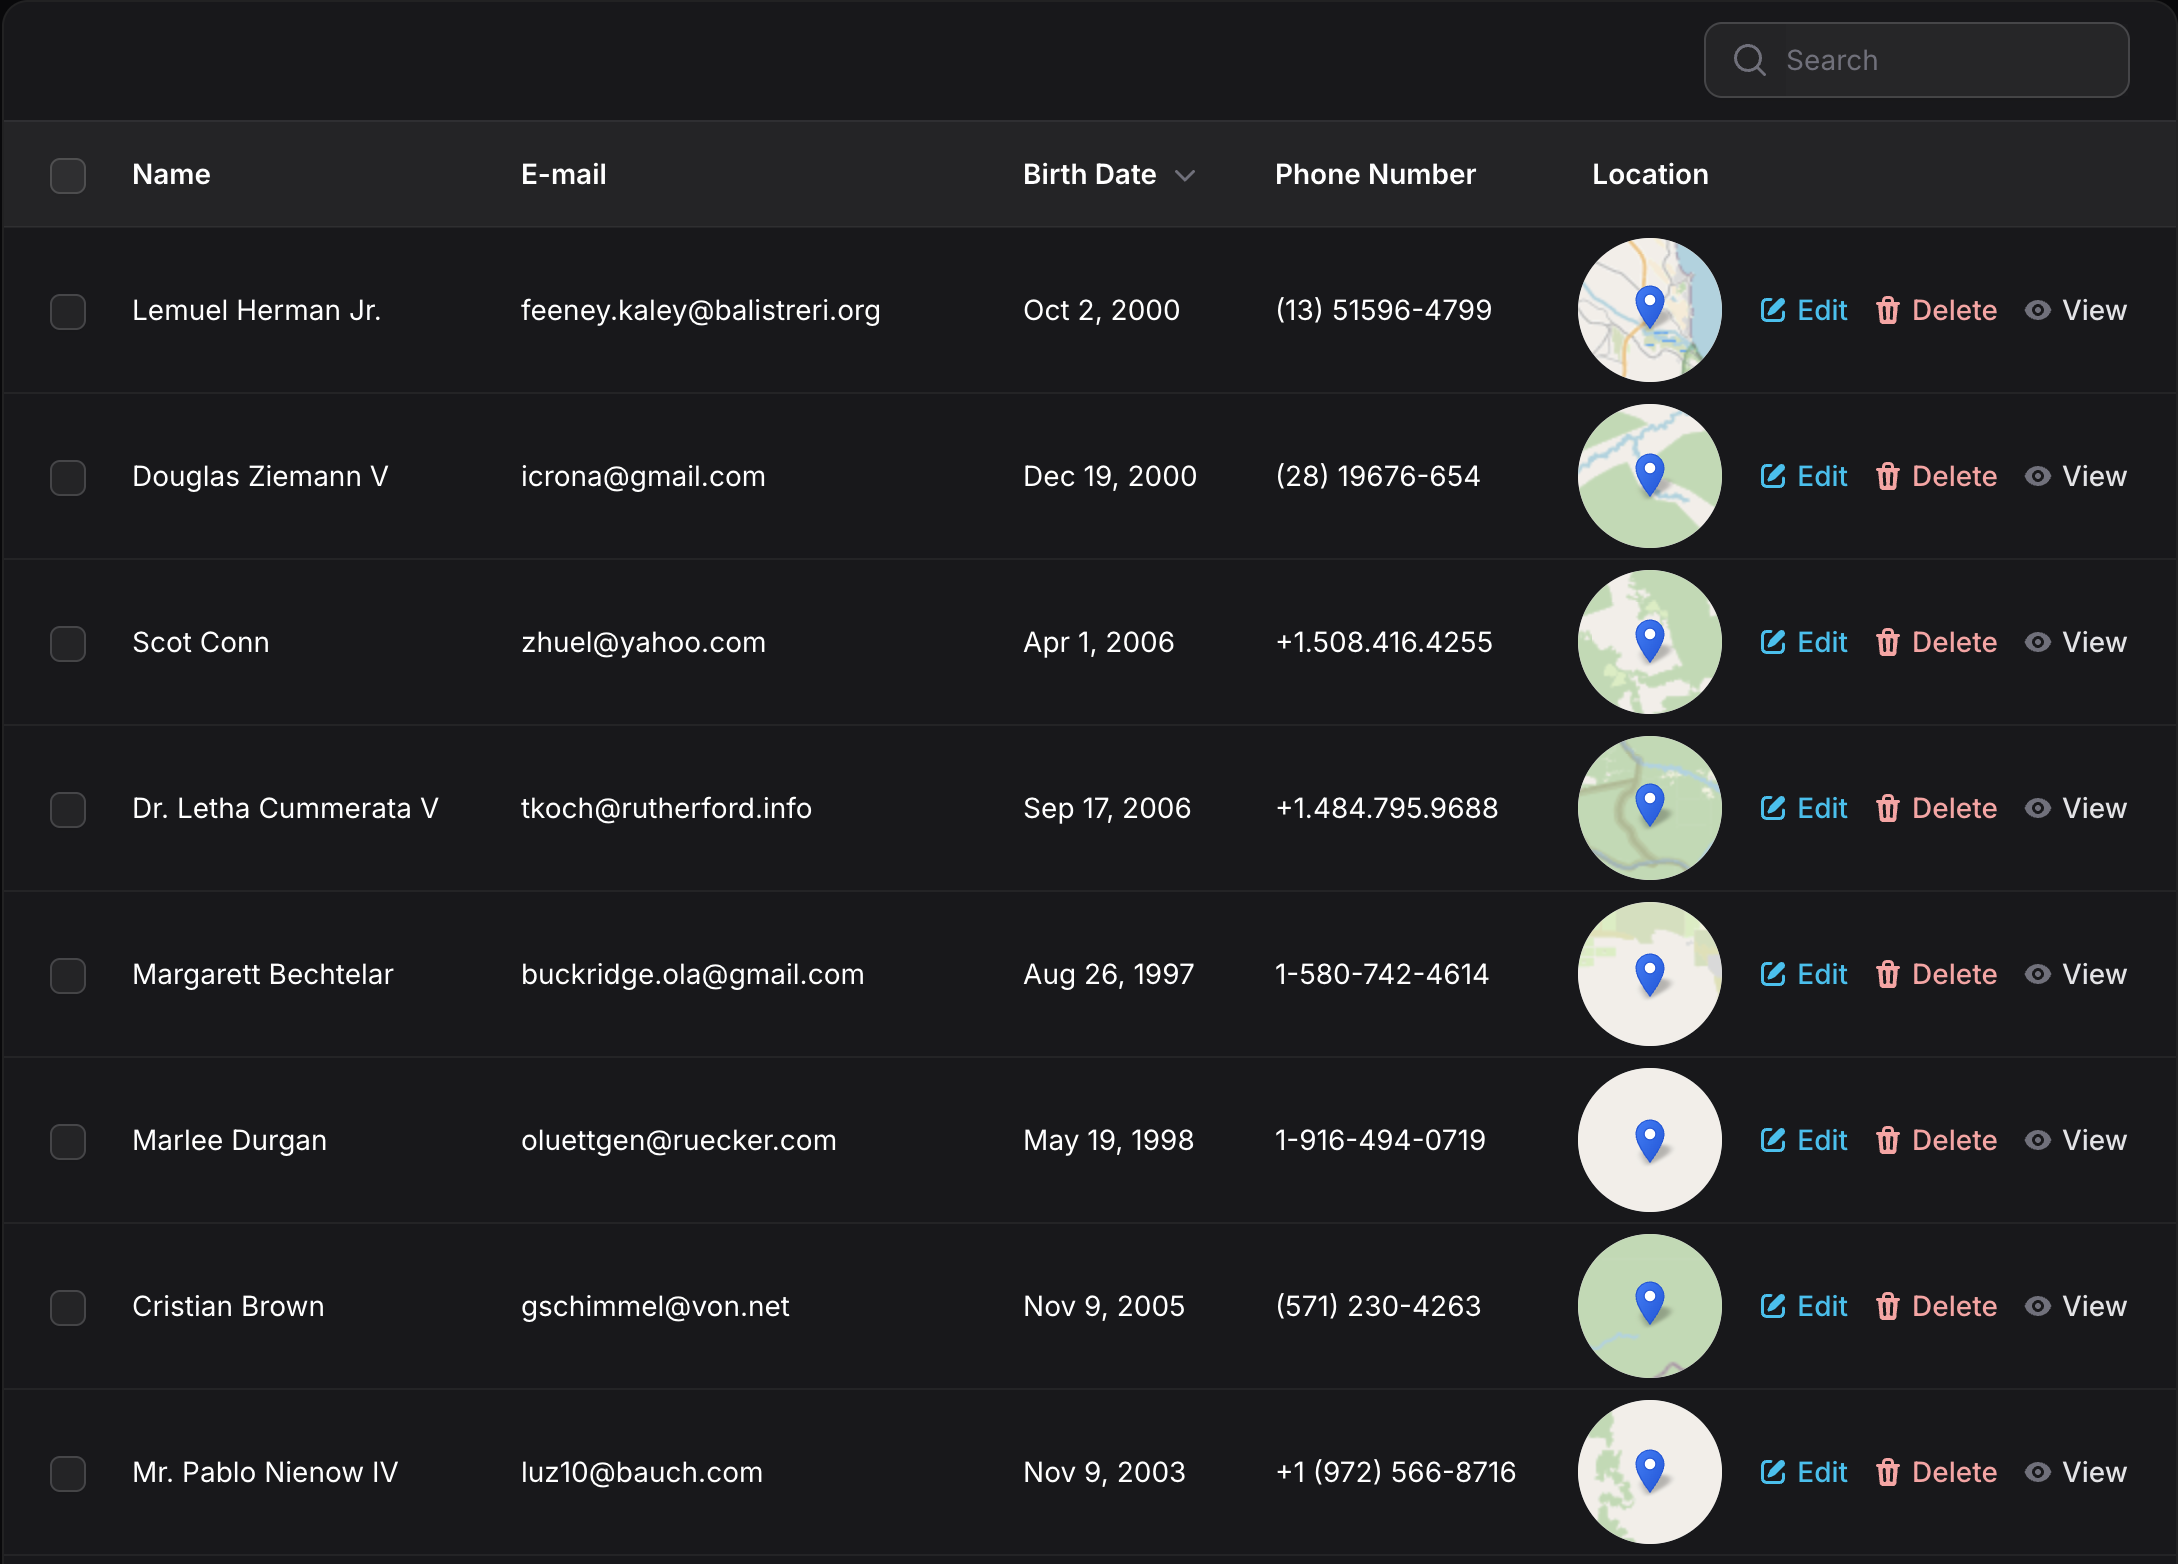
Display circular maps for a unique visual style:
MapColumn::make('location')
    ->height(72)
    ->zoom(5)
    ->pickMarker(fn(Marker $marker) => $marker->iconSize([14, 25]))
    ->circular()  // Optional: circular display
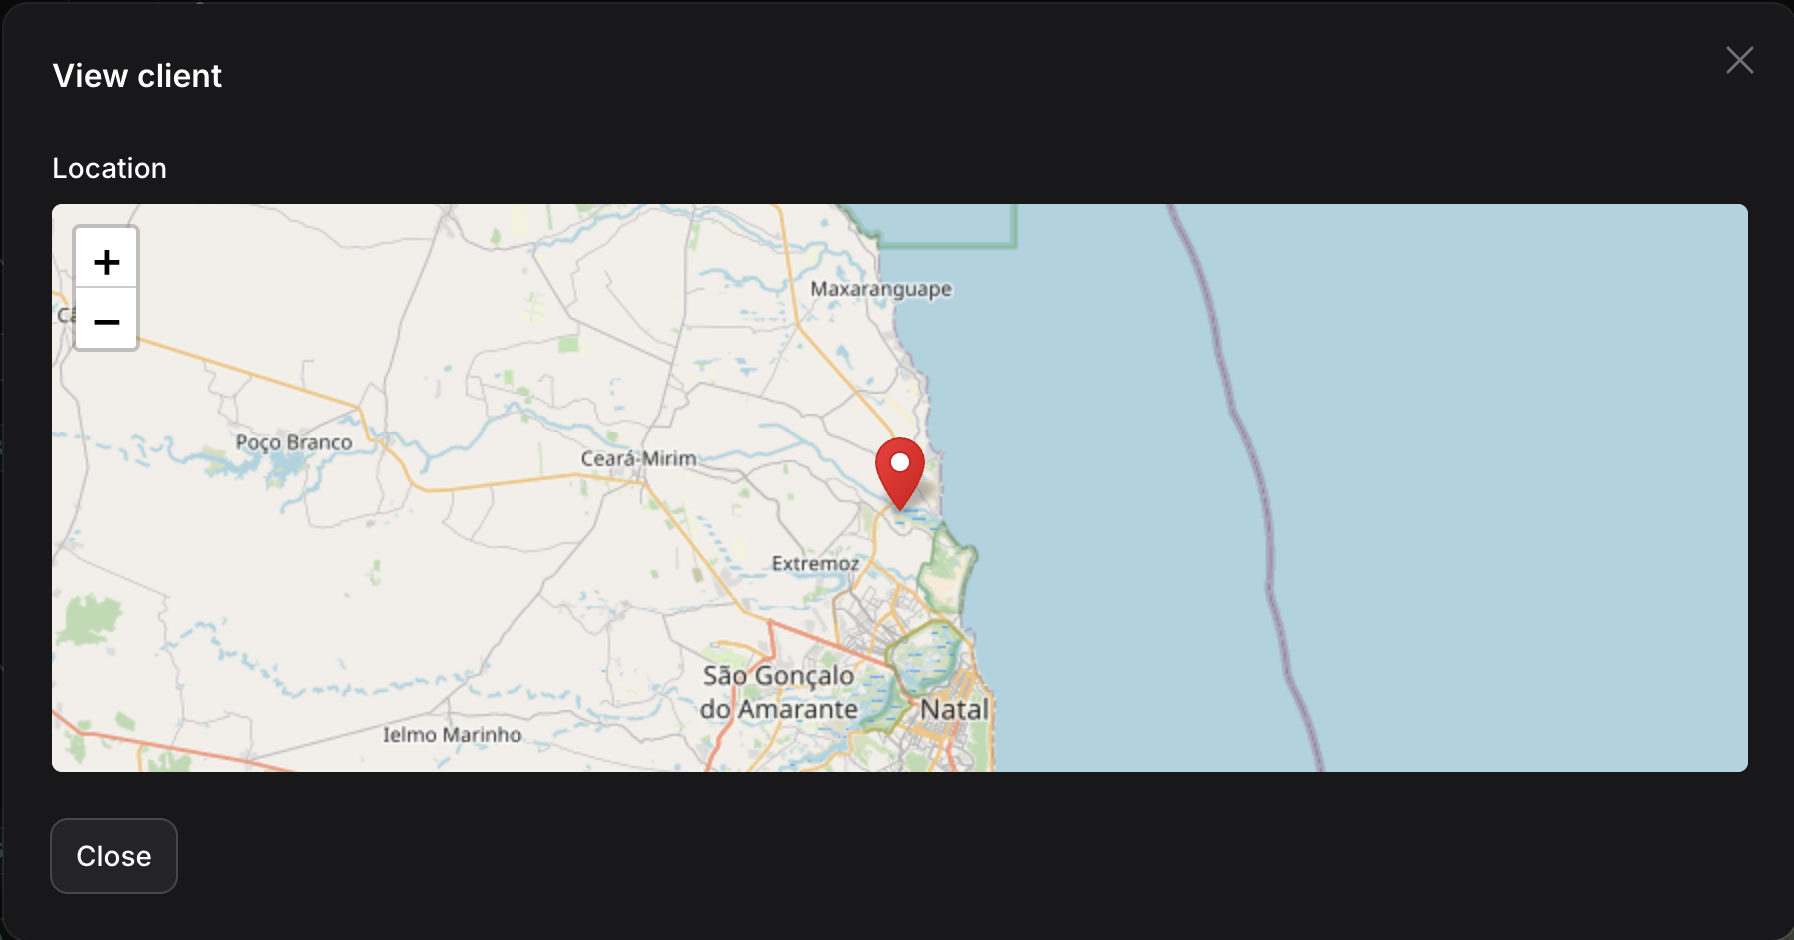
#MapEntry (Infolist)
Display read-only maps in Filament infolists:
use EduardoRibeiroDev\FilamentLeaflet\Infolists\MapEntry;
use EduardoRibeiroDev\FilamentLeaflet\Layers\Marker;

MapEntry::make('location')
    ->height(284)
    ->zoom(10)
    ->pickMarker(fn(Marker $marker) => $marker->red())
    ->static()    // Disable interactions (enabled by default)
    ->columnSpanFull()
Auto-recenter: Maps automatically recenter after 3 seconds when users pan around. This provides a guided viewing experience while allowing temporary exploration:
->recenterTimeout(5000) // Recenter after 5 seconds (null to disable)
#Map Elements
#Markers
#Creating Markers
use EduardoRibeiroDev\FilamentLeaflet\Layers\Marker;
use Filament\Support\Colors\Color;

protected function getMarkers(): array
{
    return [
        Marker::make(-23.5505, -46.6333)->title('Simple marker'),
        Marker::make(-23.5212, -46.4243)->green()->title('Colored marker'),
        Marker::make(-23.5266, -46.5412)->icon('https://leafletjs.com/examples/custom-icons/leaf-red.png', [32, 72]),
        Marker::make(-23.5300, -46.6400)->violet()->icon('heroicon-user-circle')->title('Heroicon marker'),
    ];
}
#Marker Icons
Markers support multiple icon types with different visual behaviors:
Custom Icon URL (replaces the entire marker):
Marker::make(-23.5505, -46.6333)
    ->icon('https://example.com/icon.png', [54, 54])
    ->title('Custom Icon Marker')
When using a custom icon URL, the entire marker is replaced with your custom image - the marker's color is ignored.
Heroicons (Filament Icons) (icon in center):
use Filament\Support\Icons\Heroicon;

Marker::make(-23.5505, -46.6333)
    ->icon(Heroicon::BuildingLibrary)        // Using Heroicon enum
    ->icon('heroicon-building-library')      // Using string
    ->heroicon('building-library')           // Using explicit heroicon() method
    ->iconSize([36, 54])
    ->title('Heroicon Marker')
    ->color(Color::Indigo);
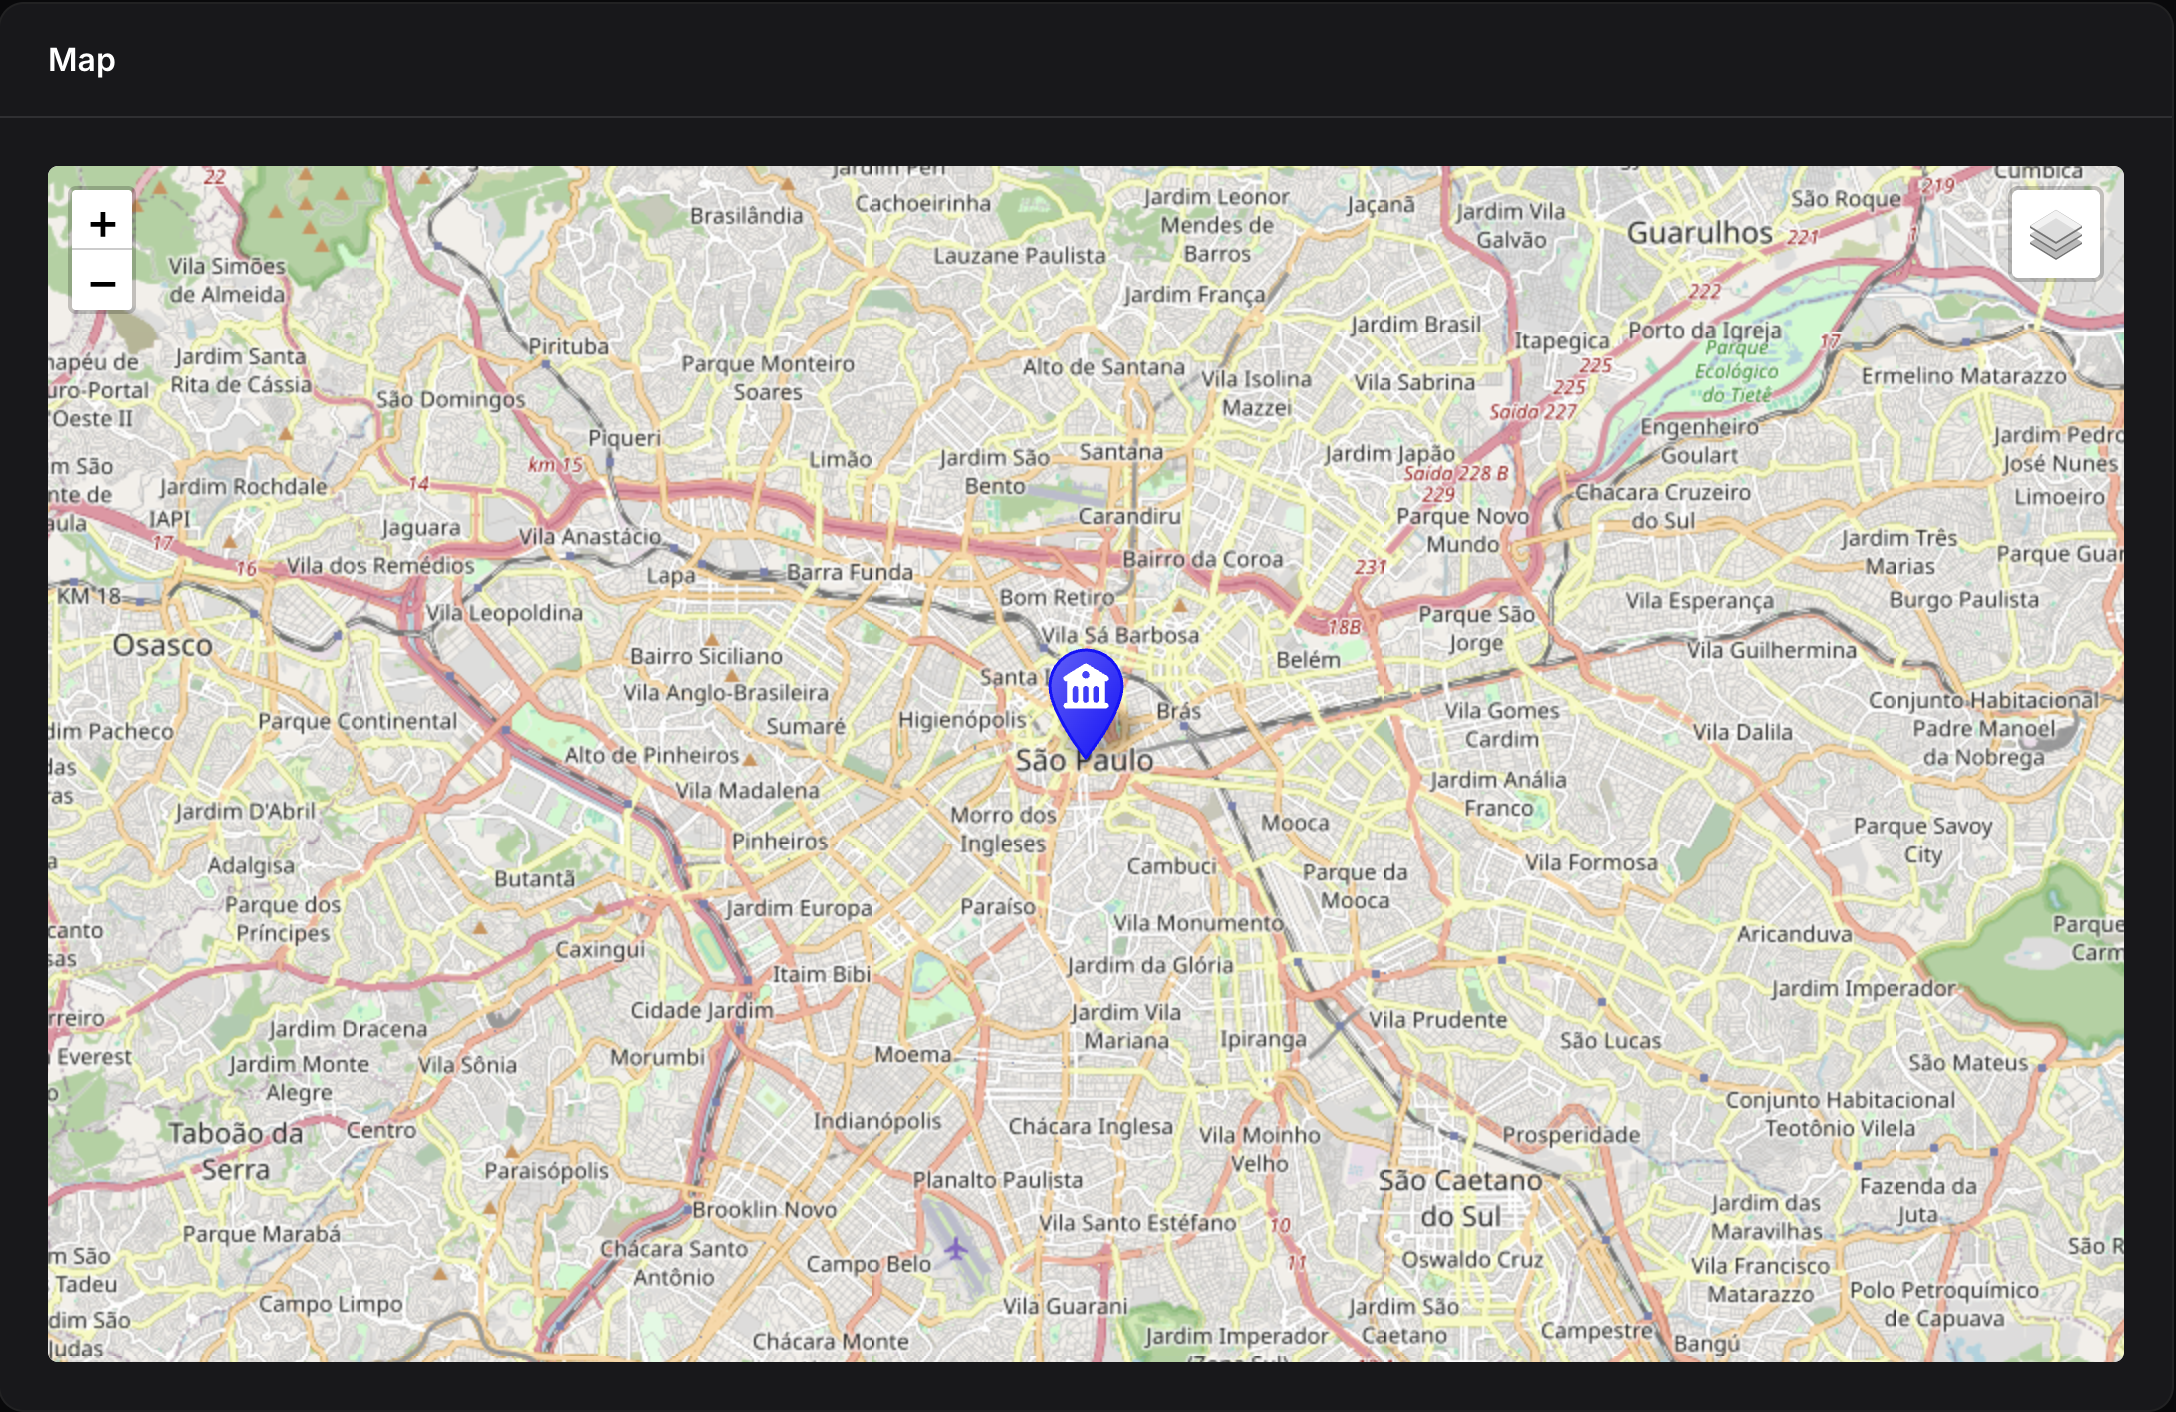
When using Heroicons, the marker keeps its default styled appearance with the color gradient, and the Heroicon is automatically rendered in the center in white. The marker's color settings (.blue(), .red(), etc.) are fully respected.
Icon Appearance:
- Icon URL: Fully replaces marker appearance (color is ignored)
- Heroicon: Keeps marker style (with color gradient) with the icon rendered in the center
#Marker Colors
Markers accept colors in multiple formats:
Using Color Class:
Marker::make(-23.5505, -46.6333)
    ->color(Color::Blue)  // Color class constant
    ->blue()              // Convenience method
Using string formats:
Marker::make(-23.5505, -46.6333)
    ->color('#3388ff')           // Hex color
    ->color('rgb(51, 136, 255)') // RGB color
    ->color('oklch(59% 0.15 262)')  // OKLCH color
Available convenience methods: blue(), red(), green(), orange(), yellow(), violet(), gray(), black(), gold(), randomColor()
#From Eloquent Models
// Basic usage
Marker::fromRecord(
    record: $store,
    coordsColumn: 'coordinates',  // Column/attribute with Coordinate value object
    titleColumn: 'name',
    descriptionColumn: 'description',
    popupFieldsColumns: ['address', 'phone'],
    color: Color::Blue,
);

// With custom callback
Marker::fromRecord(
    record: $store,
    coordsColumn: 'coordinates',
    mapRecordCallback: function (Marker $marker, Model $record) {
        $marker->gold()->popupFields(['hours' => $record->hours]);
    }
);
Note: The coordsColumn parameter expects a Coordinate value object. Configure your model like this:
use EduardoRibeiroDev\FilamentLeaflet\ValueObjects\Coordinate;

class Store extends Model
{
    protected $casts = [
        'coordinates' => Coordinate::class,
    ];
}
#Layer Groups
Layer groups are a powerful way to organize and manage multiple layers on your map. They allow you to:
- Toggle visibility - Show/hide entire groups of layers at once
- Organize layers - Group related markers and shapes together
- Improve performance - Manage large datasets efficiently
- Control layer management - Add/remove layers from groups dynamically
#Layer Group
A simple container for organizing related layers. Perfect for grouping logically related markers and shapes without any automatic behavior:
use EduardoRibeiroDev\FilamentLeaflet\LayerGroups\LayerGroup;
protected function getMarkers(): array
{
return [
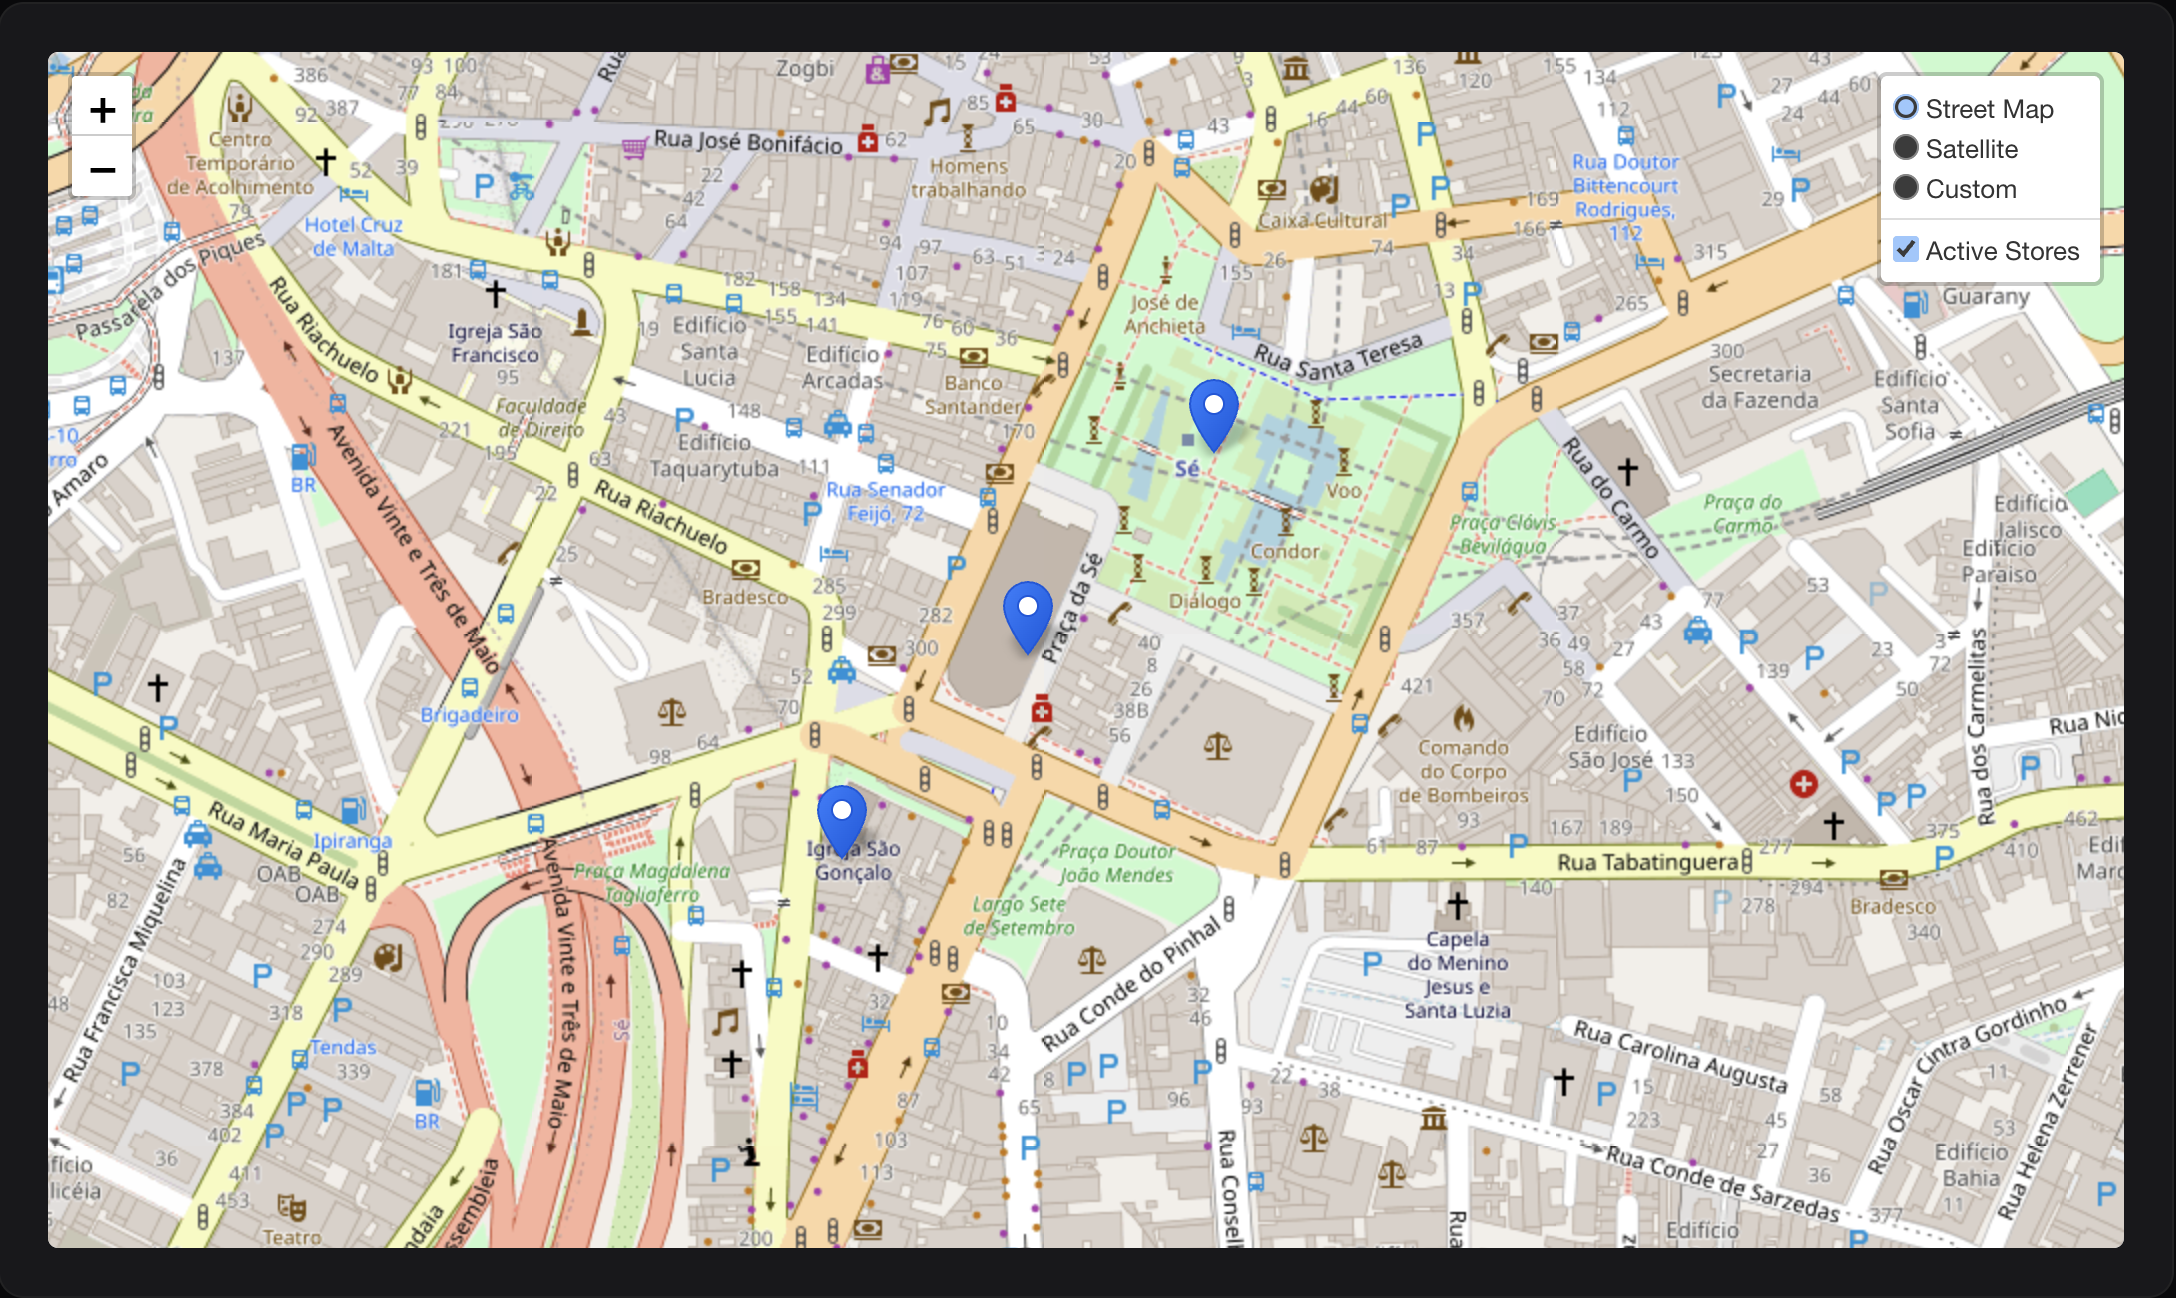
LayerGroup::make([
Marker::make(-23.5505, -46.6333)->title('Store 1'),
Marker::make(-23.5515, -46.6343)->title('Store 2'),
Marker::make(-23.5525, -46.6353)->title('Store 3'),
])
->name('Active Stores')
->id('active-stores'),
];
}
Using the group() helper method (shorthand):
Instead of wrapping layers in LayerGroup::make(), you can use the group() method on any layer to automatically group multiple layers:
protected function getMarkers(): array
{
    return [
        Marker::make(-23.5505, -46.6333)
            ->title('Store 1')
            ->group('Active Stores'),

        Marker::make(-23.5515, -46.6343)
            ->title('Store 2')
            ->group('Active Stores'),

        Marker::make(-23.5525, -46.6353)
            ->title('Store 3')
            ->group('Active Stores'),
    ];
}
#Feature Group
Creates a polygon envelope around all layers in the group. This is useful for visualizing the coverage area or boundary of a set of points:
use EduardoRibeiroDev\FilamentLeaflet\LayerGroups\FeatureGroup;
protected function getMarkers(): array
{
return [
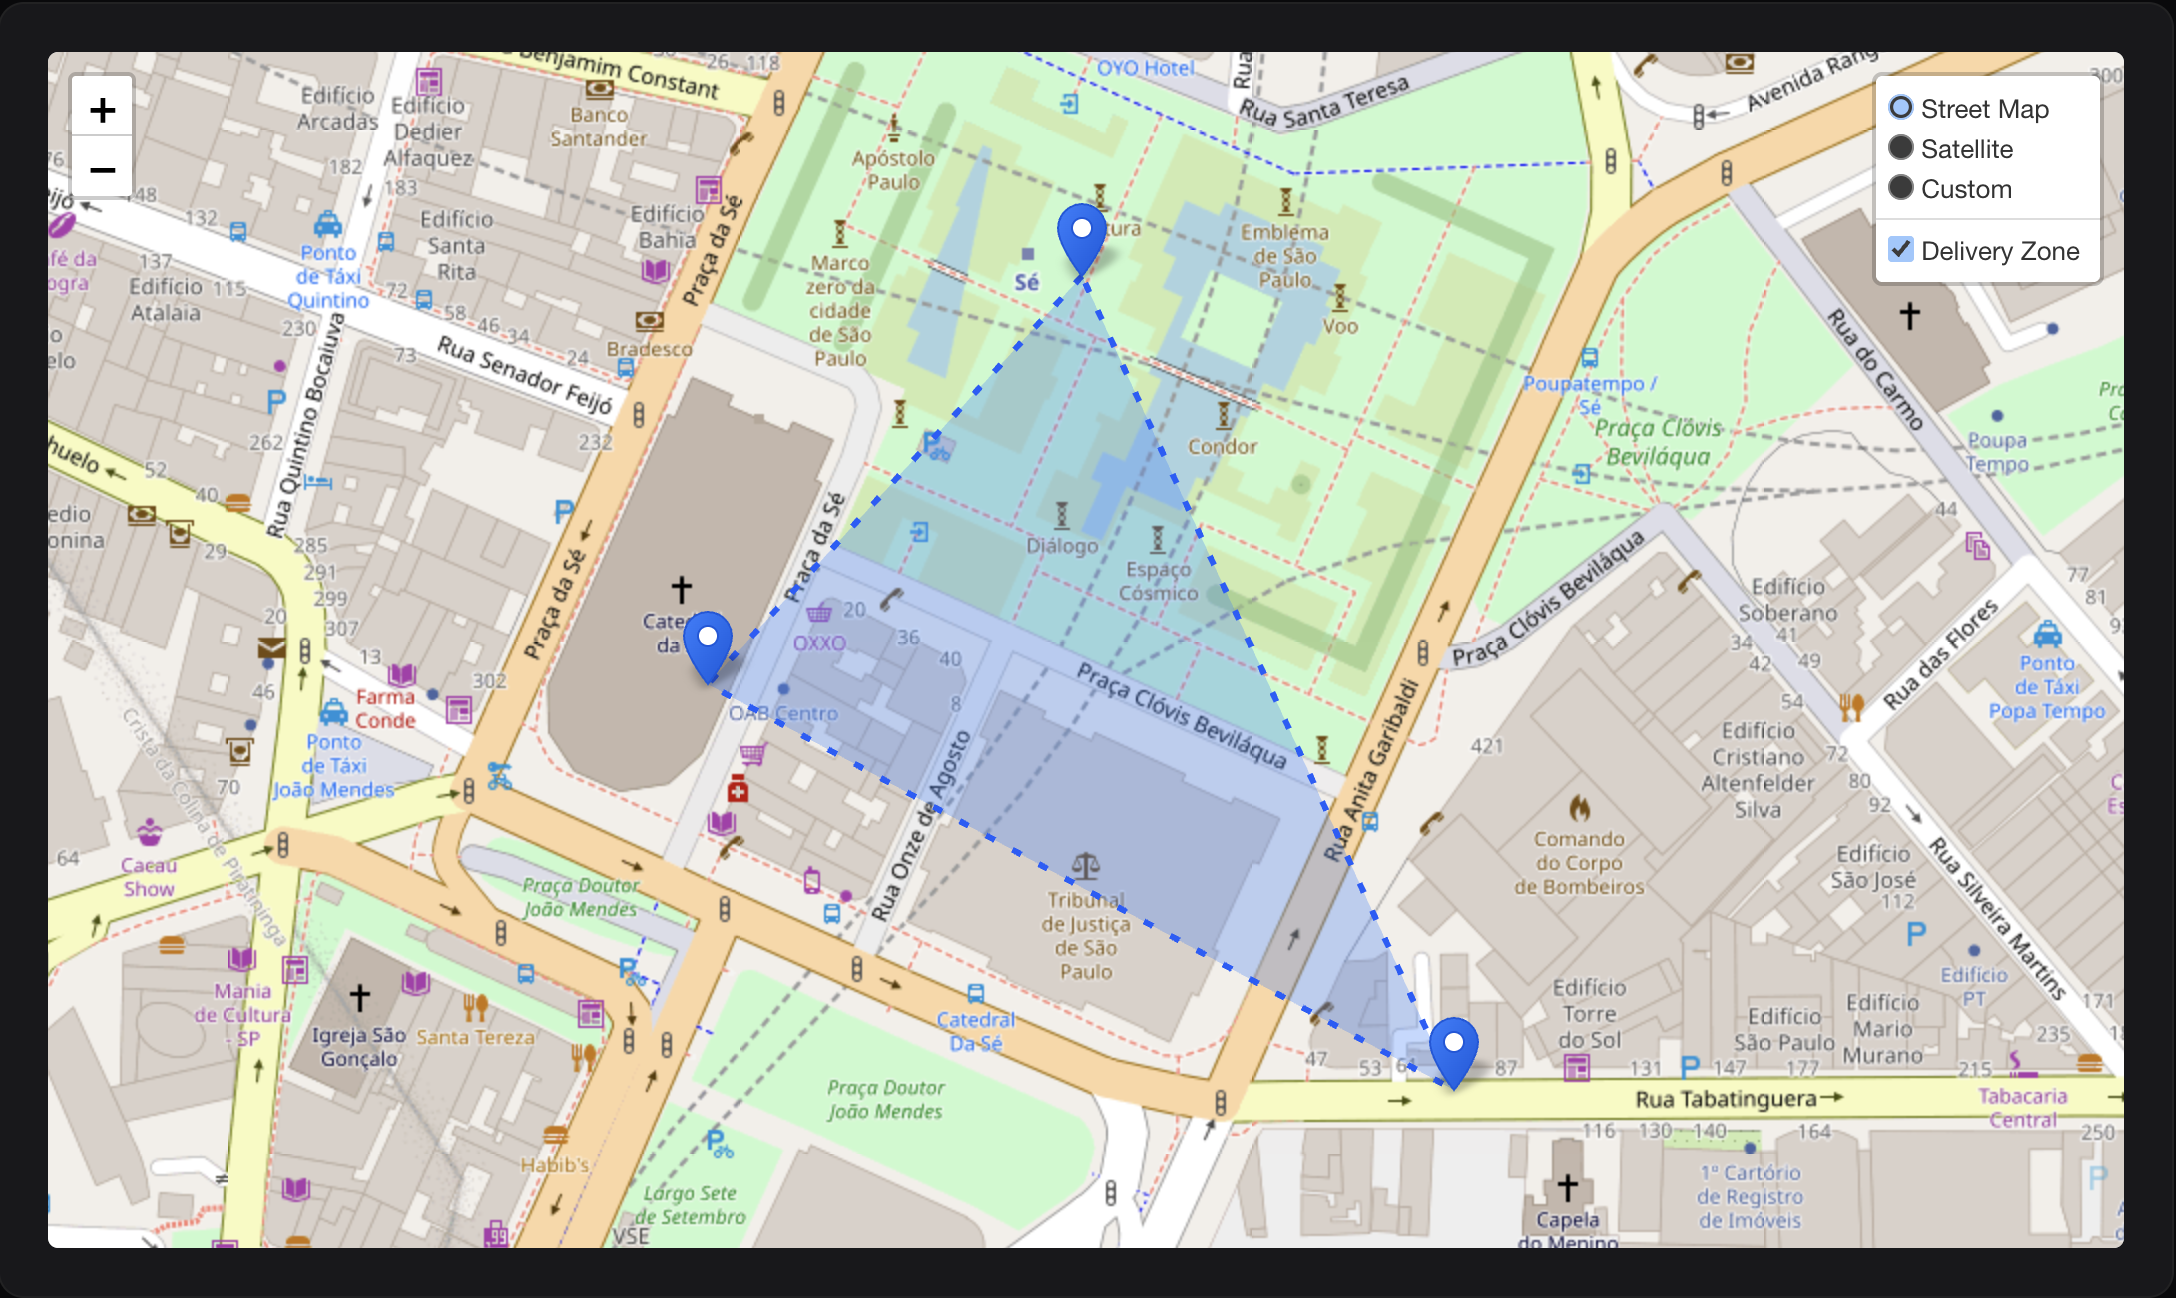
FeatureGroup::make([
Marker::make(-23.5505, -46.6333)->title('Point 1'),
Marker::make(-23.5515, -46.6343)->title('Point 2'),
Marker::make(-23.5525, -46.6323)->title('Point 3'),
])
->name('Delivery Zone')
->blue()
->fillBlue()
->fillOpacity(0.3)
->weight(3)
->dashArray(5, 10),
];
}
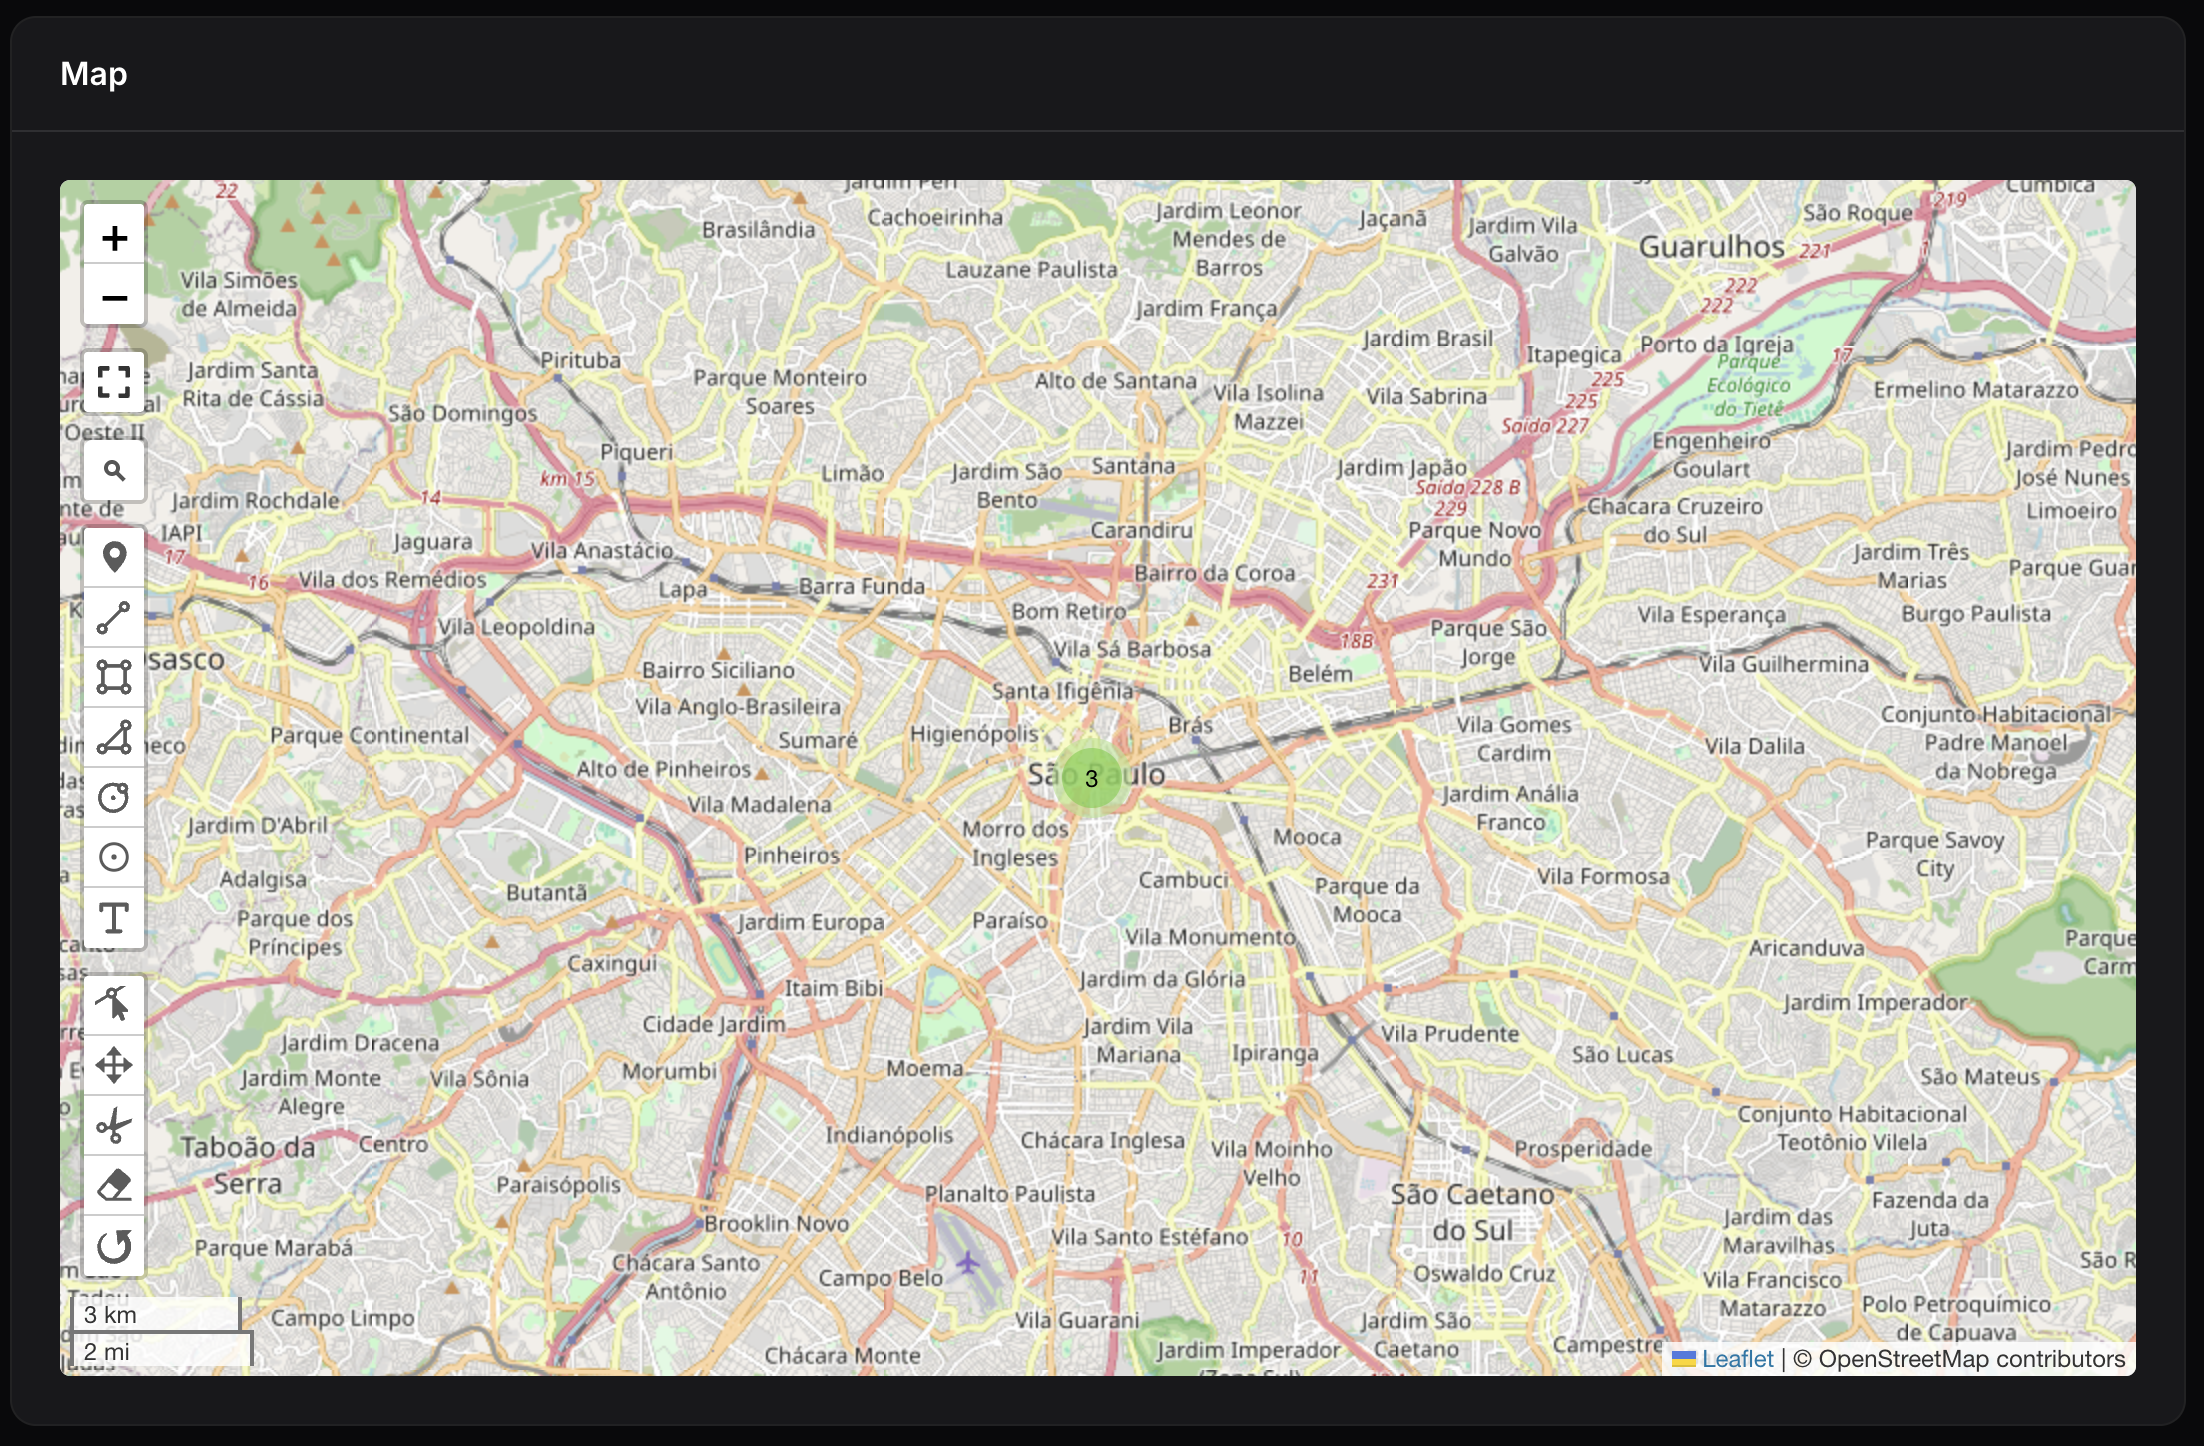
#Marker Cluster
Groups nearby markers into clusters for better performance and visual clarity, especially with large datasets. Clusters automatically expand when zooming in:
use EduardoRibeiroDev\FilamentLeaflet\LayerGroups\MarkerCluster;

protected function getMarkers(): array
{
    return [
        MarkerCluster::make([
            Marker::make(-23.5505, -46.6333)->title('Location 1'),
            Marker::make(-23.5515, -46.6343)->title('Location 2'),
            Marker::make(-23.5525, -46.6353)->title('Location 3'),
        ])
        ->maxClusterRadius(80)
        ->showCoverageOnHover()
        ->name('Locations')
        ->spiderfyOnMaxZoom(),
    ];
}
Cluster from Model:
Create clusters directly from Eloquent models with powerful customization:
use App\Models\Store;
use EduardoRibeiroDev\FilamentLeaflet\Layers\Marker;
use Filament\Support\Colors\Color;

protected function getMarkers(): array
{
    return [
        MarkerCluster::fromModel(
            model: Store::class,
            coordsColumn: 'coordinates',  // Column/attribute with Coordinate value object
            titleColumn: 'name',
            descriptionColumn: 'description',
            popupFieldsColumns: ['address', 'phone'],
            color: Color::Green,
        )
        ->maxClusterRadius(60)
        ->disableClusteringAtZoom(15),
    ];
}
Cluster with Query Modification:
Filter and customize the query used to load markers:
MarkerCluster::fromModel(
    model: Store::class,
    coordsColumn: 'coordinates',
    modifyQueryCallback: function ($query) {
        return $query
            ->where('status', 'active')
            ->where('city', 'São Paulo')
            ->orderBy('name');
    },
    mapRecordCallback: function (Marker $marker, Model $record) {
        // Customize each marker based on record properties
        if ($record->isPremium()) {
            $marker->gold()->icon('/images/premium-icon.png');
        }

        // Add status-based styling
        match($record->status) {
            'open' => $marker->green(),
            'busy' => $marker->orange(),
            'closed' => $marker->red(),
            default => $marker->gray(),
        };

        // Add popup with custom fields
        $marker->popupFields([
            'manager' => $record->manager_name,
            'staff' => $record->staff_count . ' employees',
            'rating' => $record->rating . ' ⭐',
        ]);
    }
);
Advanced cluster configuration:
MarkerCluster::make($markers)
    ->maxClusterRadius(80)              // Cluster radius in pixels
    ->showCoverageOnHover(true)         // Highlight cluster area on hover
    ->zoomToBoundsOnClick(true)         // Zoom to cluster bounds when clicked
    ->spiderfyOnMaxZoom(true)           // Spread markers at max zoom
    ->removeOutsideVisibleBounds(true)  // Remove markers outside viewport for performance
    ->disableClusteringAtZoom(15)       // Stop clustering at zoom level 15+
    ->animate(true);                    // Animate cluster changes;
#Shapes
Draw various geometric shapes on your map:
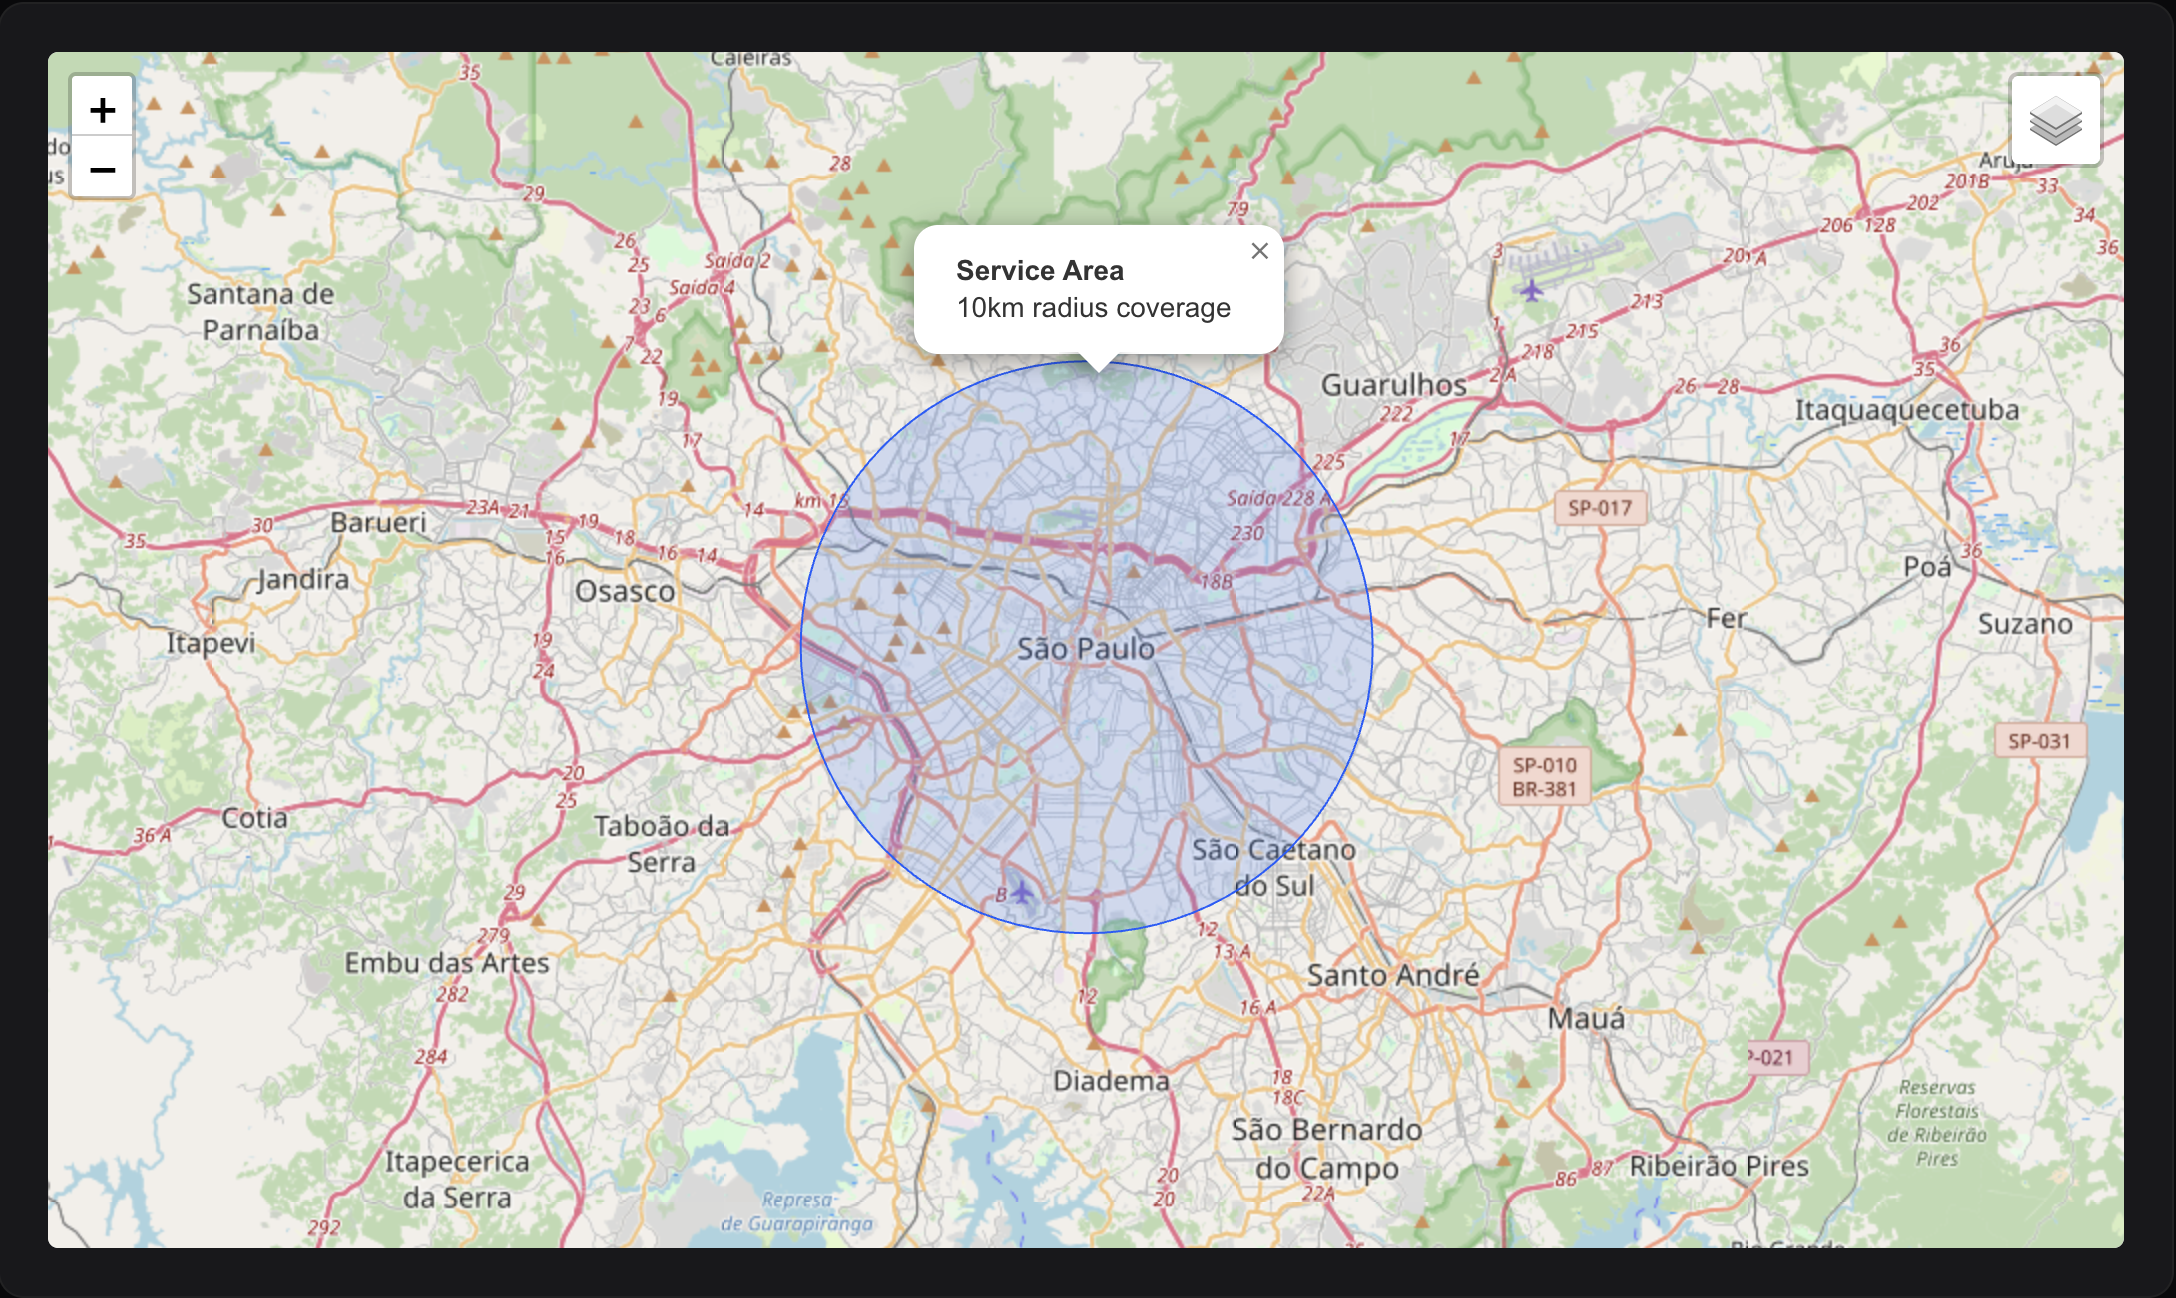
#Circles
Circles with radius in various units:
use EduardoRibeiroDev\FilamentLeaflet\Layers\Shapes\Circle;

protected function getShapes(): array
{
    return [
        Circle::make(-23.5505, -46.6333)
            ->popupContent('10km radius coverage')
            ->title('Service Area')
            ->blue()
            ->fillBlue()
            ->fillOpacity(0.2)
            ->radius(10000)           // Radius in meters (default)
            ->radiusInKilometers(10)  // Radius in kilometers
            ->radiusInMiles(6.2)      // Radius in miles
            ->radiusInFeet(32808)     // Radius in feet
    ];
}
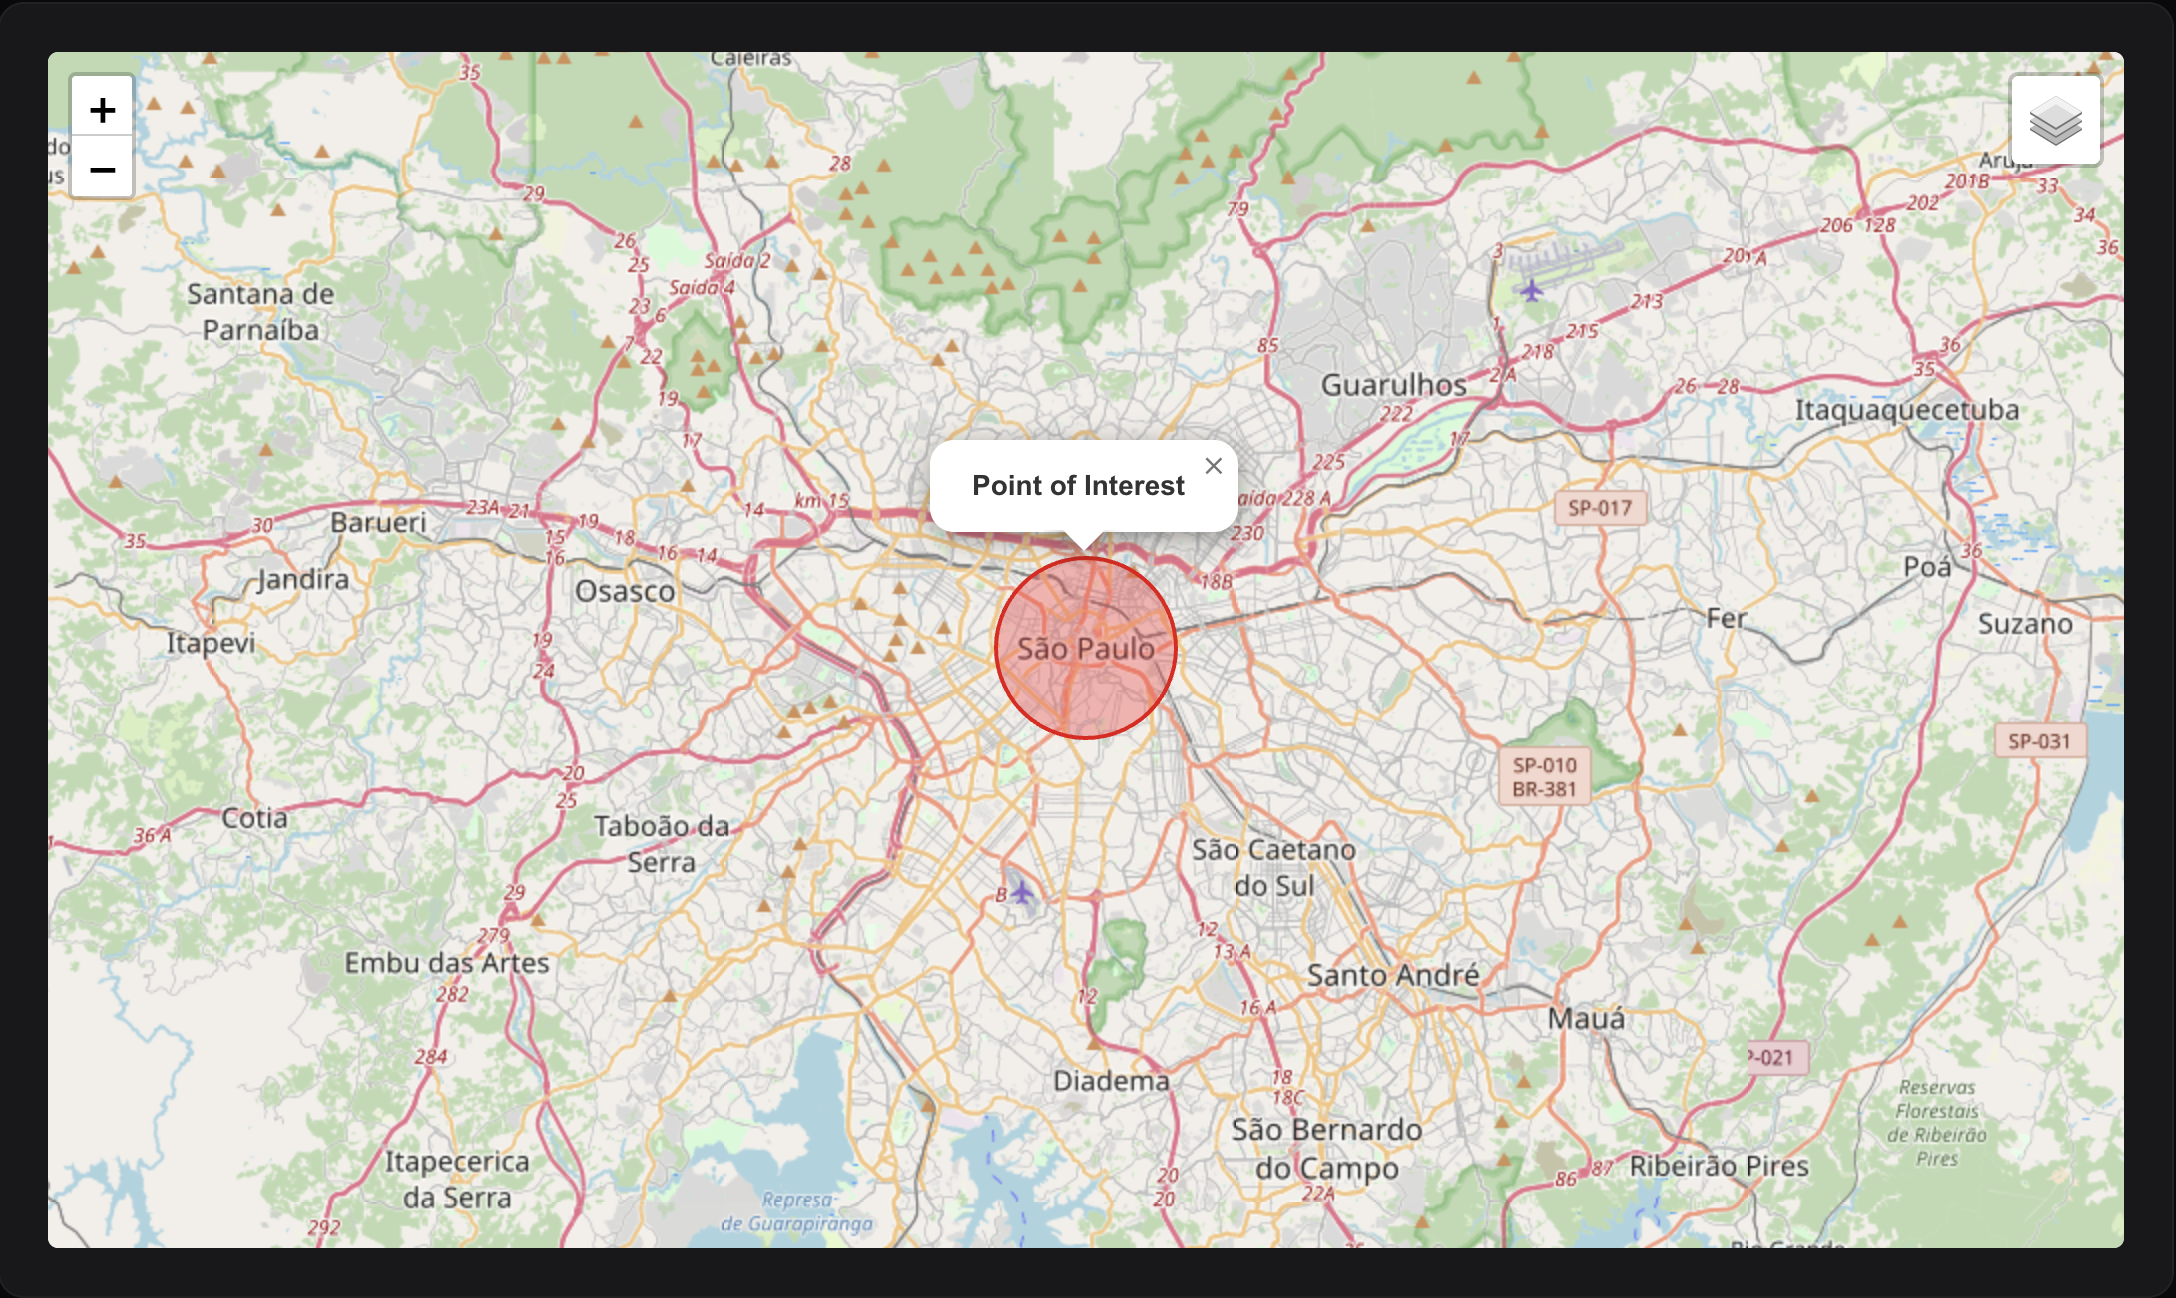
#Circle Markers
Small circles with pixel-based radius (like markers but circular):
use EduardoRibeiroDev\FilamentLeaflet\Layers\Shapes\CircleMarker;

CircleMarker::make(-23.5505, -46.6333)
    ->radius(45) // Radius in pixels
    ->red()
    ->fillRed()
    ->weight(2)
    ->title('Point of Interest');
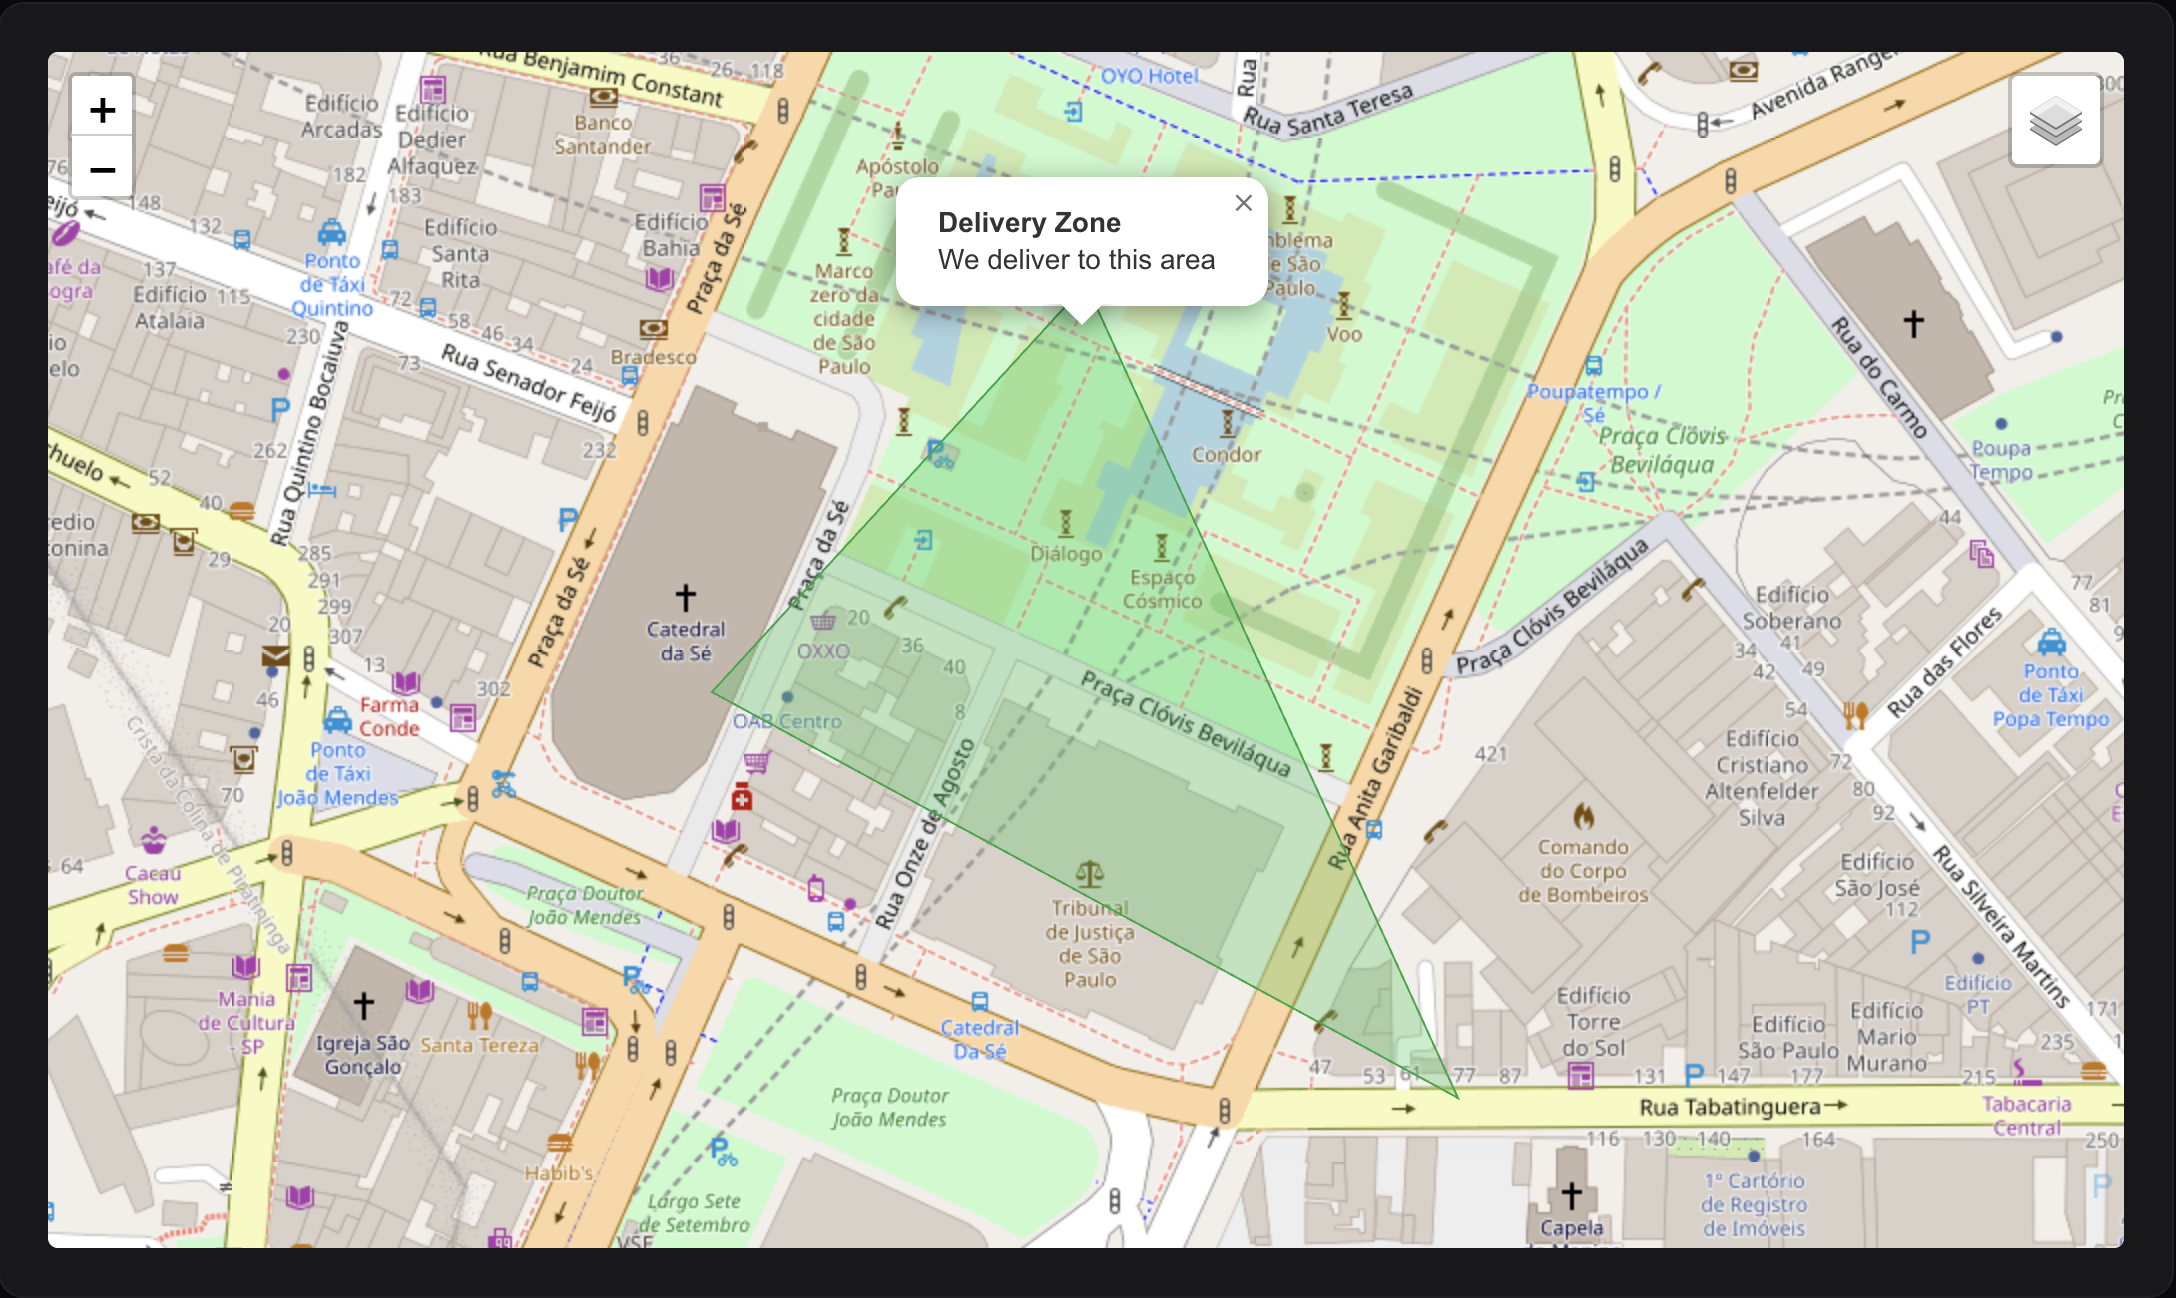
#Polygons
Draw custom polygons:
use EduardoRibeiroDev\FilamentLeaflet\Layers\Shapes\Polygon;

// Define a polygon area
Polygon::make(
    [-23.5505, -46.6333],
    [-23.5515, -46.6343],
    [-23.5525, -46.6323],
    [-23.5505, -46.6333], // Close the polygon
)
->green()
->fillGreen()
->fillOpacity(0.3)
->title('Delivery Zone')
->popupContent('We deliver to this area');

// Or build point by point
Polygon::make()
    ->addPoint(-23.5505, -46.6333)
    ->addPoint(-23.5515, -46.6343)
    ->addPoint(-23.5525, -46.6323)
    ->addPoint(-23.5505, -46.6333)
    ->blue();
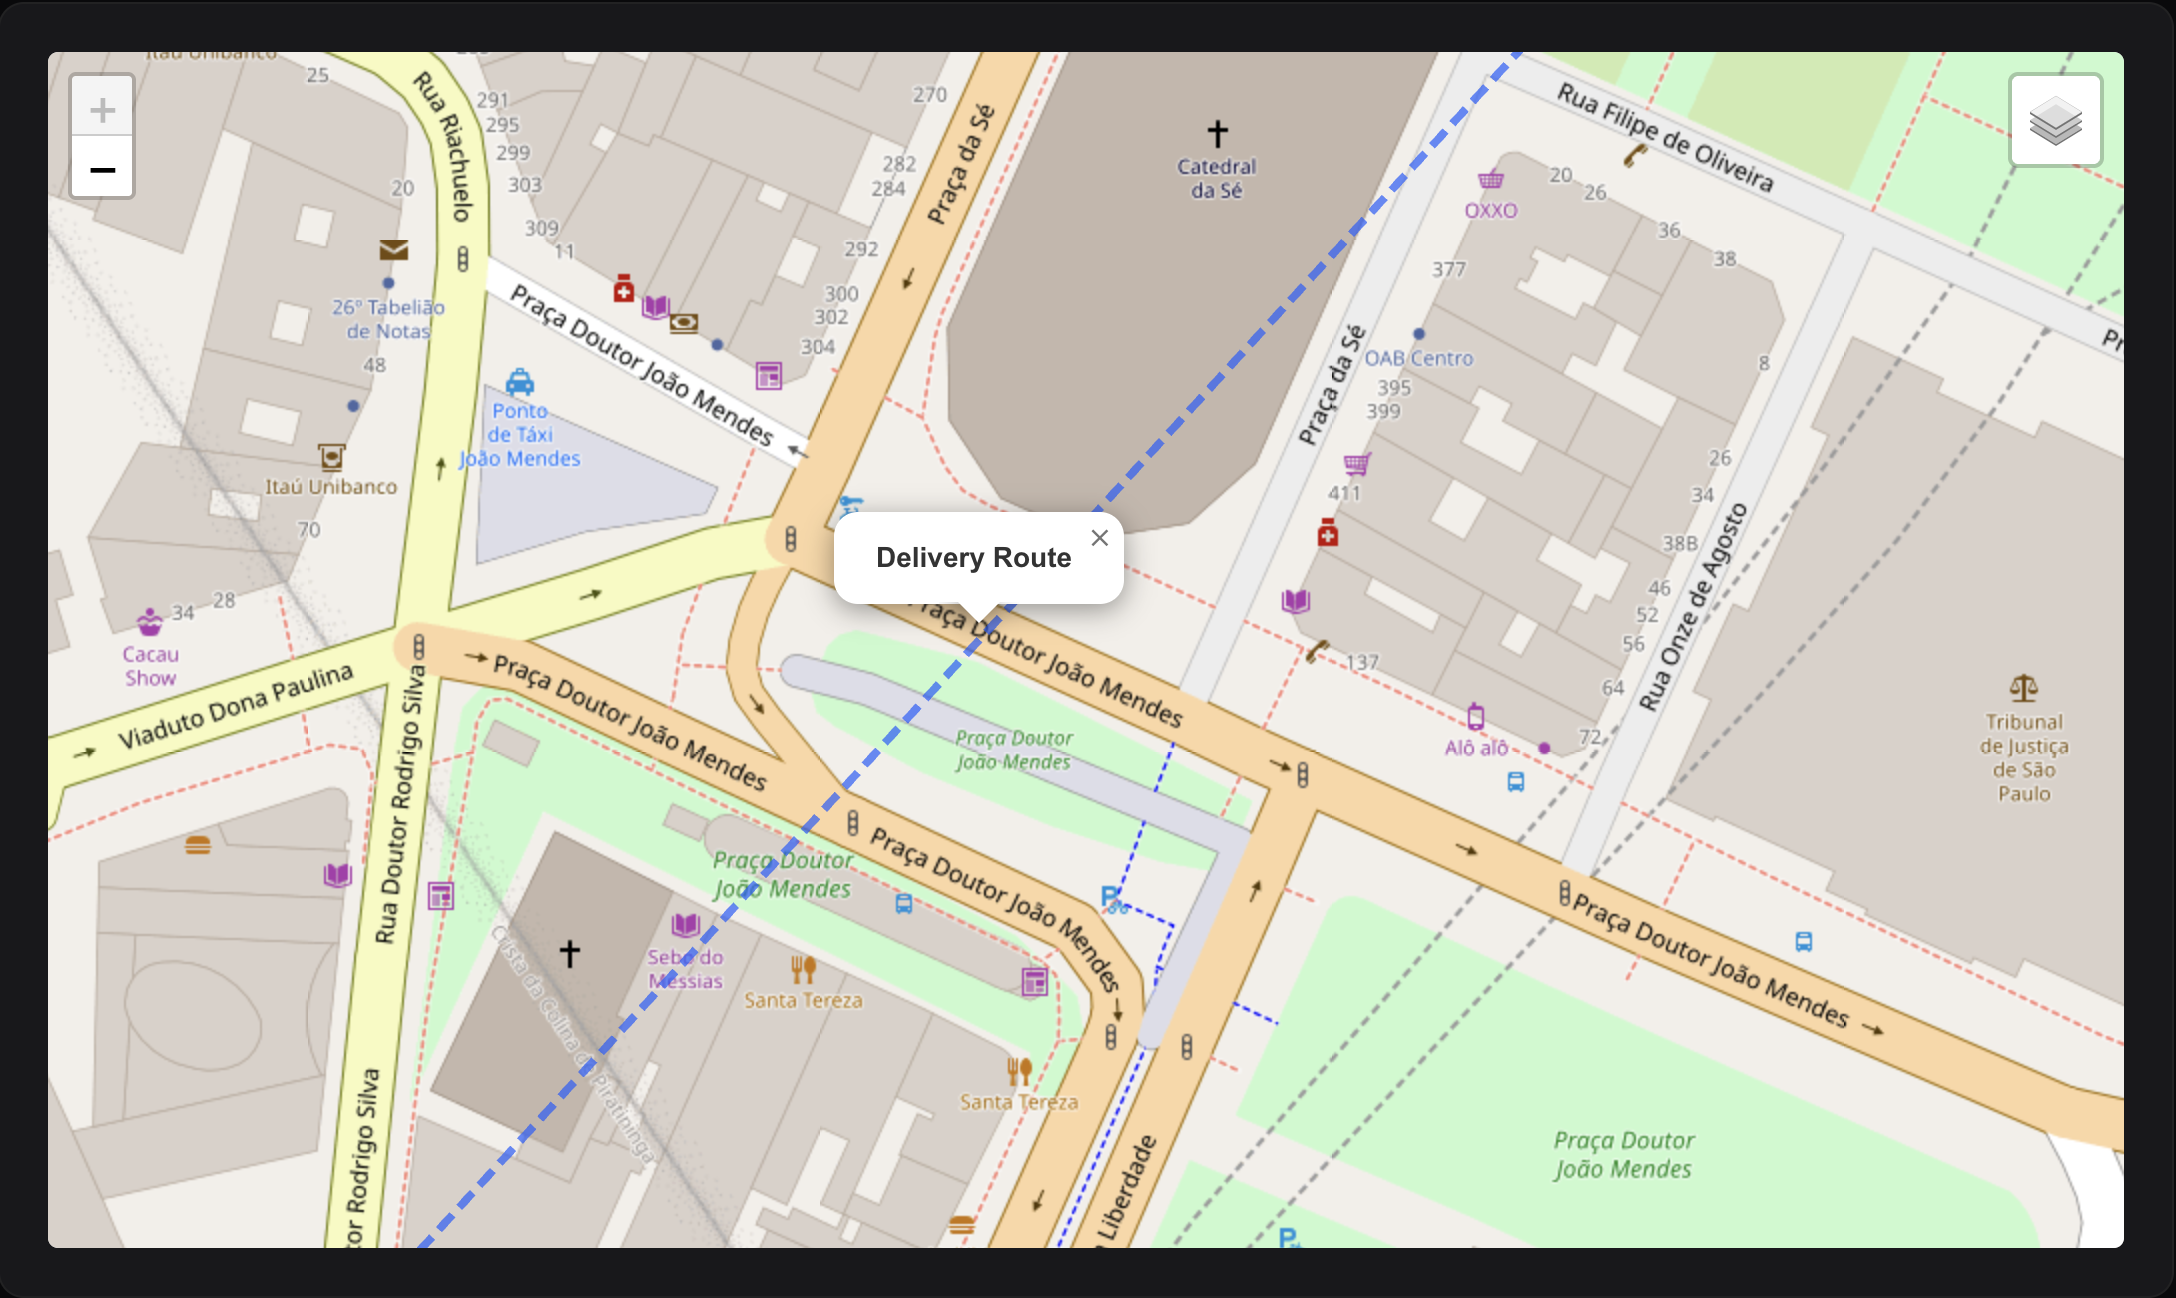
#Polylines
Draw lines connecting multiple points:
use EduardoRibeiroDev\FilamentLeaflet\Layers\Shapes\Polyline;

// Route or path
Polyline::make(
    [-23.5505, -46.6333],
    [-23.5515, -46.6343],
    [-23.5525, -46.6353],
    [-23.5535, -46.6363],
)
->blue()
->weight(4)
->opacity(0.7)
->dashArray('10, 5')      // Dashed line
->smoothFactor(1.5)       // Smooth curves
->title('Delivery Route');

// Or build incrementally
Polyline::make()
    ->addPoint(-23.5505, -46.6333)
    ->addPoint(-23.5515, -46.6343)
    ->addPoint(-23.5525, -46.6353)
    ->red()
    ->weight(3);
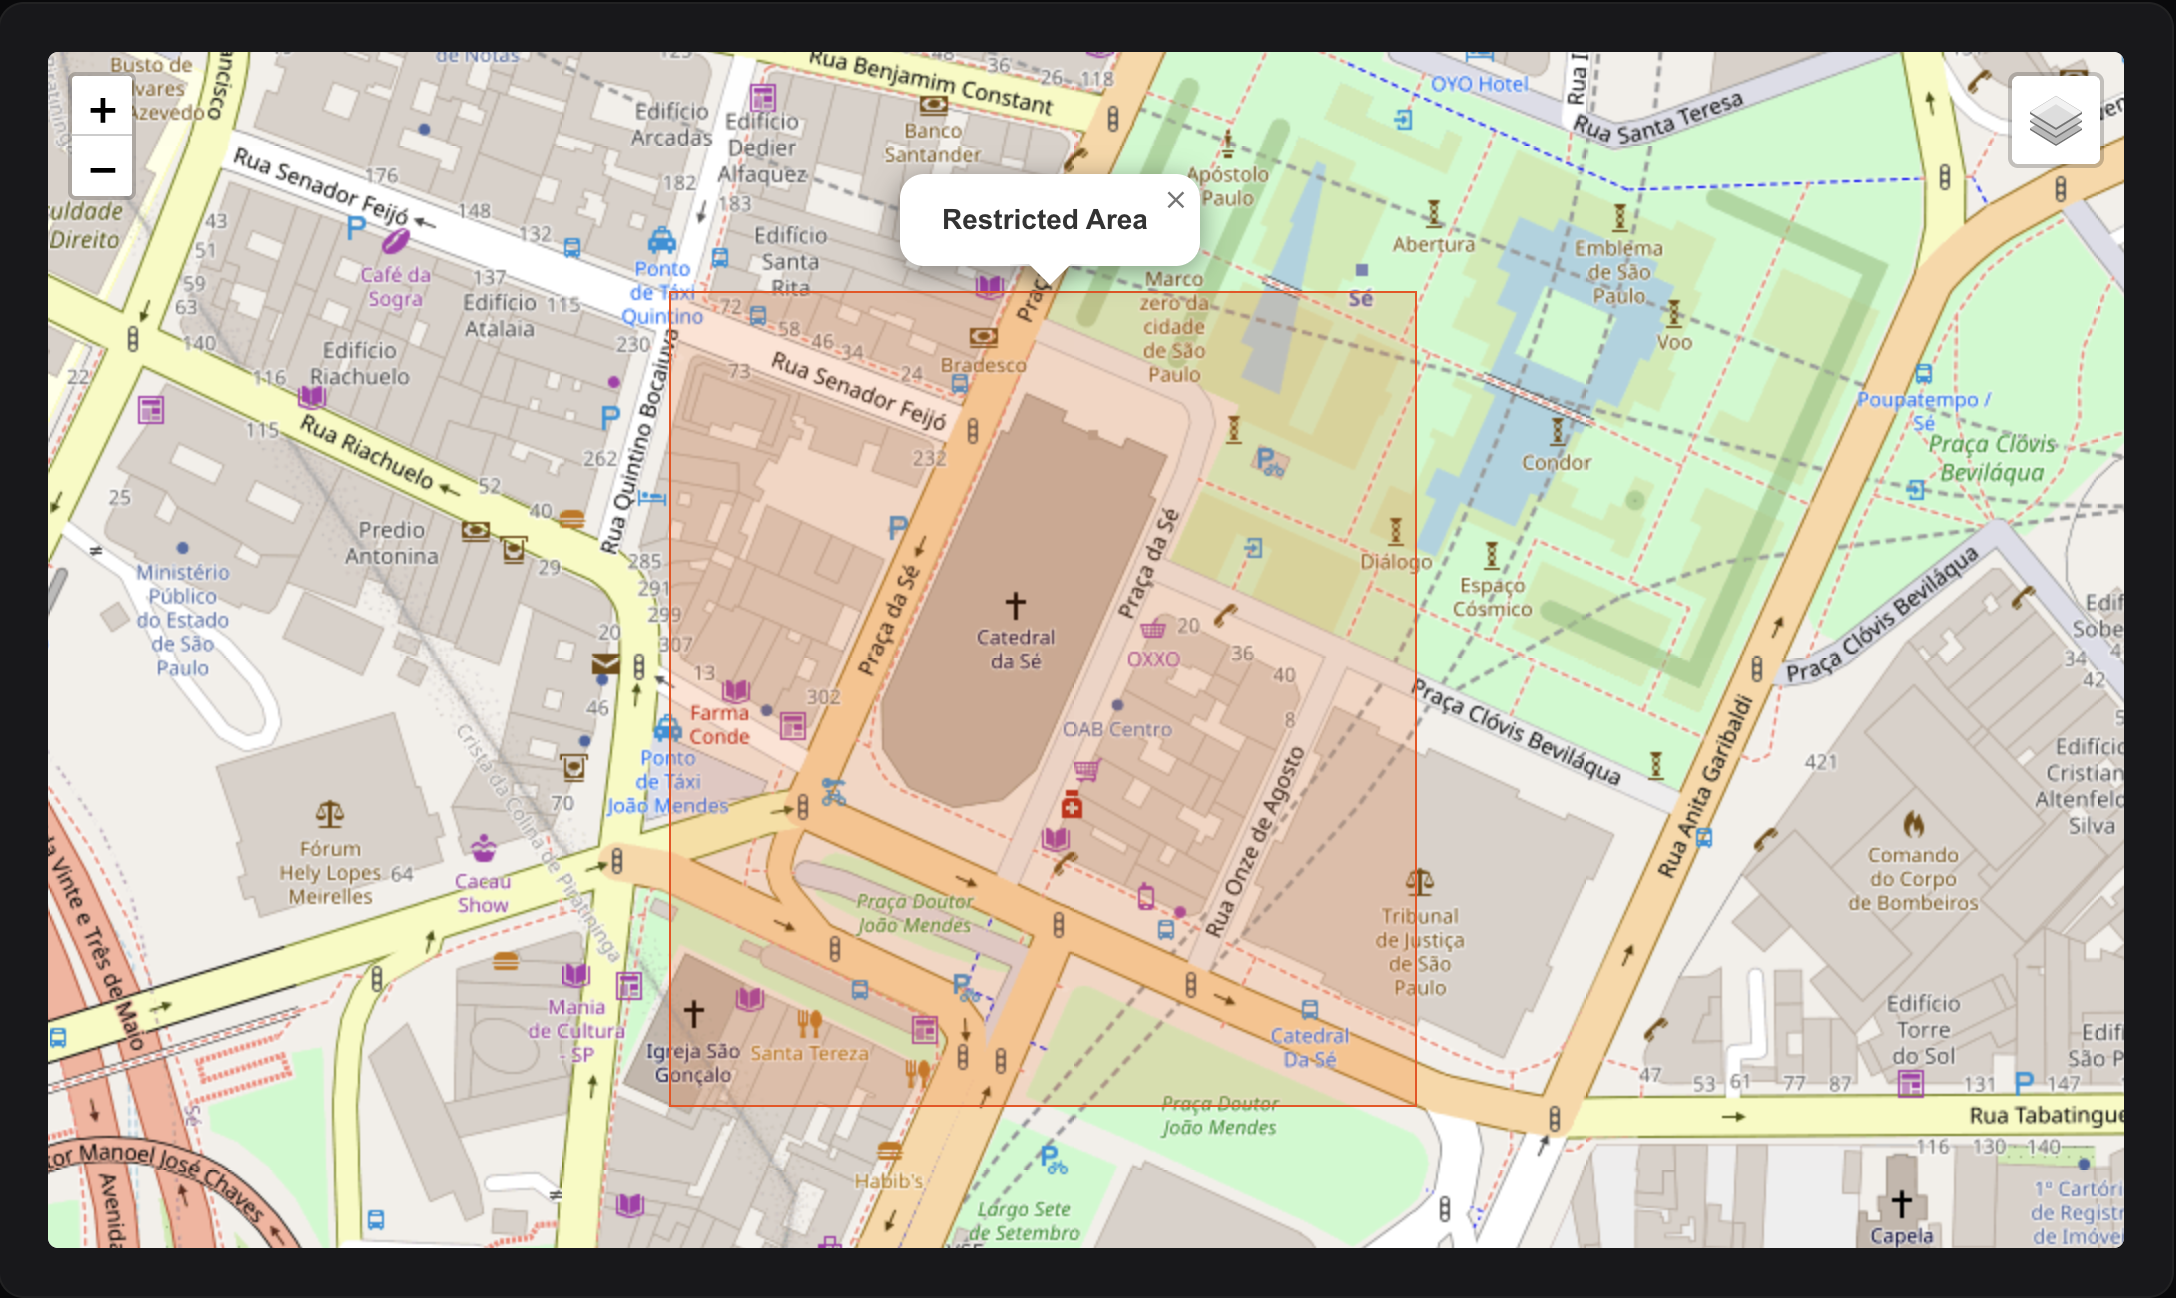
#Rectangles
Draw rectangular bounds:
use EduardoRibeiroDev\FilamentLeaflet\Layers\Shapes\Rectangle;

// Using corner coordinates
Rectangle::make(
    [-23.5505, -46.6333],  // Southwest corner
    [-23.5525, -46.6353]   // Northeast corner
)
->orange()
->fillOrange()
->fillOpacity(0.2)
->title('Restricted Area');

// Alternative syntax
Rectangle::makeFromCoordinates(
    -23.5505, -46.6333,    // Southwest lat, lng
    -23.5525, -46.6353     // Northeast lat, lng
)
->red();
#Shapes from Eloquent Models
All shape classes support fromRecord() factory methods for easy creation from database records:
use App\Models\DeliveryZone;
use EduardoRibeiroDev\FilamentLeaflet\Layers\Shapes\Circle;
use EduardoRibeiroDev\FilamentLeaflet\Layers\Shapes\Polygon;
use EduardoRibeiroDev\FilamentLeaflet\Layers\Shapes\Polyline;
use EduardoRibeiroDev\FilamentLeaflet\Layers\Shapes\Rectangle;
use EduardoRibeiroDev\FilamentLeaflet\Layers\Shapes\CircleMarker;

protected function getShapes(): array
{
    return DeliveryZone::all()->map(function ($zone) {
        // Circle from record
        return Circle::fromRecord(
            record: $zone,
            coordsColumn: 'center_coordinates',
            radiusColumn: 'coverage_radius_km',
            titleColumn: 'name',
            descriptionColumn: 'description',
            popupFieldsColumns: ['address', 'radius'],
        );
    })->all();
}
Configure Your Model:
use EduardoRibeiroDev\FilamentLeaflet\ValueObjects\Coordinate;

class DeliveryZone extends Model
{
    protected $casts = [
        'center_coordinates' => Coordinate::class,
    ];
}
Each shape type supports the fromRecord() method with common parameters:
record: The Eloquent model instancecoordsColumn: Column name for center coordinates (for Circle, CircleMarker) - expects aCoordinatevalue objectradiusColumn: Column name for radius (for Circle, CircleMarker)pointsColumn: Column name for points array (for Polygon, Polyline)boundsColumn: Column name for bounds array (for Rectangle)titleColumn: Column name for the shape titledescriptionColumn: Column name for the popup contentpopupFieldsColumns: Array of column names to include in popupcolor: Default color for the shapesyncRecord: Whether to sync changes back to the record when edited (default: true from config)mapRecordCallback: Closure to customize the shape based on the record
#Circle from Record
Circle::fromRecord(
    record: $zone,
    coordsColumn: 'center',
    radiusColumn: 'coverage_radius_km',
    titleColumn: 'zone_name',
    descriptionColumn: 'zone_description',
    mapRecordCallback: fn(Circle $circle, $record) =>
        $circle->radiusInKilometers($record->coverage_radius_km)
);
#Polygon from Record
// Assumes database structure: points => [[lat, lng], [lat, lng], ...]
Polygon::fromRecord(
    record: $zone,
    pointsColumn: 'boundary_points',
    titleColumn: 'zone_name',
    popupFieldsColumns: ['area_sqkm', 'population'],
);
#Polyline from Record
// Store route as JSON array of [lat, lng] coordinates
Polyline::fromRecord(
    record: $deliveryRoute,
    pointsColumn: 'route_path',
    titleColumn: 'route_name',
    descriptionColumn: 'destination',
    mapRecordCallback: fn(Polyline $line, $record) =>
        $record->is_completed
            ? $line->green()->weight(2)
            : $line->red()->weight(3)
);
#Rectangle from Record
// Assumes database structure: bounds => [[lat1, lng1], [lat2, lng2]]
Rectangle::fromRecord(
    record: $territory,
    boundsColumn: 'service_bounds',
    titleColumn: 'territory_name',
    popupFieldsColumns: ['region', 'sales_person'],
);
#Shape Styling
Circle::make(-23.5505, -46.6333)
    ->radius(5000)

    // Border styling
    ->color(Color::Blue)        // Border color
    ->weight(3)                 // Border width in pixels
    ->opacity(0.8)              // Border opacity (0-1)
    ->dashArray('5, 10')        // Dashed border pattern

    // Fill styling
    ->fillColor(Color::Green)   // Fill color
    ->fillOpacity(0.3)          // Fill opacity (0-1)
#Editable Layers
Make markers and shapes editable directly on the map by enabling the draw control:
class MyMapWidget extends MapWidget
{
    protected bool $hasEditLayersControl = true;

    protected function getMarkers(): array
    {
        return [
            Marker::make(-23.5505, -46.6333)
                ->title('Editable Marker')
                ->editable(),  // Make this marker editable

            Circle::make(-23.5505, -46.6333)
                ->radiusInKilometers(5)
                ->editable(),  // Make this circle editable
        ];
    }
}
You can also make all layers in a group editable:
LayerGroup::make([
    Marker::make(-23.5505, -46.6333)->title('Point 1'),
    Marker::make(-23.5515, -46.6343)->title('Point 2'),
    Marker::make(-23.5525, -46.6353)->title('Point 3'),
])
->name('Editable Points')
->editable(),  // All markers in the group are now editable
#User Interactions
#Popups and Tooltips
#Tooltips (appear on hover)
Marker::make(-23.5505, -46.6333)
    ->tooltip(
        content: 'São Paulo City',
        permanent: false,
        direction: 'top',
        options: ['offset' => [0, -20]]
    );

// Or using individual methods
Marker::make(-23.5505, -46.6333)
    ->tooltipContent('São Paulo')
    ->tooltipPermanent(true)
    ->tooltipDirection('top');
#Popups (appear on click)
Marker::make(-23.5505, -46.6333)
    ->popupTitle('Store Location')
    ->popupContent('Visit our main store')
    ->popupFields([
        'address' => '123 Main Street',
        'phone' => '+55 11 1234-5678',
        'email' => 'contact@store.com',
    ])
    ->popupOptions(['maxWidth' => 300]);

// Or use shorthand
Marker::make(-23.5505, -46.6333)
    ->popup(
        content: 'Store description',
        fields: ['address' => '123 Main St', 'phone' => '+55 11 1234-5678'],
        options: ['maxWidth' => 300]
    );
How popup fields work: Keys are automatically converted to title case, underscores replaced with spaces, and translated using Laravel's __() helper. Both keys and values support translation keys.
#Combined Usage
Marker::make(-23.5505, -46.6333)
    ->title('Pizza Palace')
    ->popupContent('Best pizza in town')
    ->popupFields([
        'address' => '123 Main St',
        'phone' => '+55 11 1234-5678',
        'rating' => '4.5 ⭐',
    ]);
#Click Actions
#Marker Click Handler
use Filament\Notifications\Notification;

Marker::make(-23.5505, -46.6333)
    ->title('Interactive Marker')
    ->action(function (Marker $marker) { // Or ->onClick()
        Notification::make()
            ->title('Marker Clicked!')
            ->body('ID: ' . $marker->getId())
            ->send();
    });
#Shape Click Handler
Circle::make(-23.5505, -46.6333)
    ->radius(5000)
    ->action(function (Circle $circle) { // Or ->onClick()
        Notification::make()
            ->title('Circle clicked')
            ->send();
    });
#From Model Records
protected function getMarkers(): array
{
    return Store::all()->map(function ($store) {
        return Marker::fromRecord($store)->action(function (Marker $marker, Store $record) { // Or ->onClick()
            Notification::make()
                ->title("You clicked: {$record->name}")
                ->body("Address: {$record->address}")
                ->send();

            return redirect()->route('stores.show', $record);
        });
    })->all();
}
#Map Click Handler
Handle clicks on the map itself:
public function handleMapClick(float $latitude, float $longitude): void
{
    Notification::make()
        ->title('Map clicked')
        ->body("Coordinates: {$latitude}, {$longitude}")
        ->send();
}
#Field/Entry/Column Click Handlers
Handle map clicks in form fields, infolists, or table columns:
use EduardoRibeiroDev\FilamentLeaflet\Fields\MapPicker;
use Filament\Notifications\Notification;

MapPicker::make('location')
    ->height(300)
    ->onMapClick(function (float $latitude, float $longitude) {
        Notification::make()
            ->title('Location Selected')
            ->body("Lat: {$latitude}, Lng: {$longitude}")
            ->send();
    });
Handle layer (marker/shape) clicks:
use EduardoRibeiroDev\FilamentLeaflet\Layers\BaseLayer;

MapPicker::make('location')
    ->height(300)
    ->onLayerClick(function (BaseLayer $layer) {
        Notification::make()
            ->title('Layer Clicked')
            ->body("Layer ID: {$layer->getId()} - Type: {$layer->getType()}")
            ->send();
    });
#Advanced Features
#Model Integration & CRUD Operations
Enable creating markers directly from map clicks:
use App\Models\Location;

class LocationMapWidget extends MapWidget
{
    protected ?string $markerModel = Location::class;
    protected string $coordinatesColumnName = 'coordinates';

    protected function getFormComponents(): array
    {
        return [
            TextInput::make('name')->required(),
            ColorPicker::make('color')->rgb(),
            Textarea::make('description')->columnSpanFull(),
        ];
    }
}
When users click the map, a form modal opens to create a new marker. The widget automatically converts latitude/longitude into the configured coordinates column.
Built-in Marker Actions:
Define custom actions to execute when clicking markers with records using the $markerClickAction property:
use App\Models\Store;

class LocationMapWidget extends MapWidget
{
    protected ?string $markerModel = Store::class;
    protected string $coordinatesColumnName = 'coordinates';

    // Define the action to execute when a marker is clicked
    protected ?string $markerClickAction = 'view'; // 'view', 'edit', 'delete' or null

    protected function getMarkers(): array
    {
        return Store::all()->map(fn($store) =>
            Marker::fromRecord(
                record: $store,
                coordsColumn: 'coordinates',
                titleColumn: 'name',
            )
        )->all();
    }
}
Available marker click actions:
'view'- Display a read-only modal with the marker's record details'edit'- Open an edit form for the marker's record (default)'delete'- Prompt to delete the marker's recordnull- No action
Using a Resource Form:
use App\Filament\Resources\Locations\LocationResource;

class LocationMapWidget extends MapWidget
{
    protected ?string $markerModel = Location::class;
    protected ?string $markerResource = LocationResource::class;
}
Hooks:
protected function afterMarkerCreated(Model $record): void
{
    Notification::make()
        ->title('Location created!')
        ->body("Created: {$record->name}")
        ->success()
        ->send();
}

protected function mutateFormDataBeforeCreate(array $data): array
{
    $data['user_id'] = auth()->id();
    $data['status'] = 'active';
    return parent::mutateFormDataBeforeCreate($data);
}
Keep Maps in Sync with Tables:
use EduardoRibeiroDev\FilamentLeaflet\Concerns\InteractsWithMap;

class ManageLocations extends ManageRecords
{
    use InteractsWithMap;
}
This automatically refreshes the map after create/edit/delete actions.
#GeoJSON Density Maps
Display choropleth maps with custom density data:
class BrazilDensityWidget extends MapWidget
{
    protected ?string $geoJsonUrl = 'https://example.com/brazil-states.json';

    protected array $geoJsonColors = [
        '#FED976', '#FEB24C', '#FD8D3C', '#FC4E2A',
        '#E31A1C', '#BD0026', '#800026',
    ];

    protected function getGeoJsonData(): array
    {
        return [
            'SP' => 166.23,  // São Paulo
            'RJ' => 365.23,  // Rio de Janeiro
            'MG' => 33.41,   // Minas Gerais
        ];
    }

    protected function getGeoJsonTooltip(): string
    {
        return <<<HTML
            <h4>{state}</h4>
            <b>Population Density: {density} per km²</b>
        HTML;
    }
}
Colors are automatically applied based on data distribution.
#Multi-Language Support
The package includes built-in support for: English (en), Portuguese (pt_BR, pt_PT), Spanish (es), French (fr), German (de), Italian (it).
All draw control labels, tooltips, and messages are automatically translated based on your application's locale.
To customize translations:
php artisan vendor:publish --tag=filament-leaflet-translations
Then edit files in lang/vendor/filament-leaflet.
#Best Practices
#Performance Optimization
- Use Marker Clusters for large datasets:
// Bad: 1000 individual markers
protected function getMarkers(): array
{
    return Store::all()->map(fn($s) => Marker::fromRecord($s))->all();
}

// Good: Clustered markers
protected function getMarkers(): array
{
    return [
        MarkerCluster::fromModel(Store::class)
            ->maxClusterRadius(80)
    ];
}
- Limit data with query modifications:
MarkerCluster::fromModel(
    model: Store::class,
    modifyQueryCallback: fn($q) => $q->limit(100)->latest()
)
- Use appropriate zoom levels:
protected int $defaultZoom = 12;  // City level
protected int $maxZoom = 18;      // Street level
protected int $minZoom = 3;       // Country level
#Debugging
Enable logging for map interactions:
public function handleMapClick(float $latitude, float $longitude): void
{
    logger("Map clicked", compact('latitude', 'longitude'));
}
#Configuration Reference
#Customization
#Custom Styles
Add custom CSS to your map:
public function getCustomStyles(): string
{
    return <<<CSS
        .custom-marker {
            filter: hue-rotate(45deg);
        }

        .leaflet-popup-content {
            font-family: 'Inter', sans-serif;
        }
    CSS;
}
#Custom Scripts
Execute JavaScript after map initialization:
public function getCustomScripts(): string
{
    return <<<JS
        function customFunction() {
            // Your code
        }
    JS;
}
#Method Reference
#GeoSearchInput
| Method | Description |
|---|---|
provider($provider) |
Set geocoding provider (Nominatim, GoogleMaps, Mapbox, BingMaps) |
limit($count) |
Set maximum results (1–50, default 25) |
withAddressDetails($enabled) |
Include structured address in results (default true) |
language($code) |
Set preferred language (e.g., 'pt-BR', 'en') |
countryCodes($codes) |
Restrict to country codes (e.g., 'br', ['br', 'ar']) |
viewbox($minLon, $minLat, $maxLon, $maxLat) |
Set bounding box to bias/restrict results |
bounded($enabled) |
Strictly restrict results to viewbox (default false) |
cacheResults($ttl) |
Cache results for given seconds (default 3600) |
minSearchLength($chars) |
Minimum characters before searching (default 2) |
useShortLabels($enabled) |
Use short labels instead of full address (default false) |
textMode($enabled) |
Return text only instead of coordinates (default false) |
#MapWidget
| Method | Description |
|---|---|
getHeading() |
Returns the widget heading |
getAutoCenter() |
Returns the auto-center setting |
getMarkers() |
Returns array of markers to display |
getShapes() |
Returns array of shapes to display |
getLayers() |
Returns combined markers and shapes |
onMapClick($lat, $lng) |
Handles map click events |
onLayerClick($layerId) |
Handles layer click events |
refreshMap() |
Manually refresh the map |
afterMarkerCreated($record) |
Hook after marker creation |
mutateFormDataBeforeCreate($data) |
Transform form data before save |
$markerClickAction |
Define action for marker clicks (view/edit/delete) |
$markerModel |
Eloquent model class for markers (enables CRUD) |
$markerResource |
Optional Filament Resource for marker actions |
$coordinatesColumnName |
Optional Column name for coordinates in CRUD (null uses config default) |
#MapPicker
| Method | Description |
|---|---|
make($name) |
Create a new MapPicker field |
autoCenter(bool) |
Auto-center map to user's current location |
center($lat, $lng) |
Set map center coordinates |
zoom($level) |
Set initial zoom level |
height($pixels) |
Set map height |
mapDraggable($bool) |
Enable/disable map dragging |
mapZoomable($bool) |
Enable/disable map zooming |
static() |
Disable all map interactions (dragging & zooming) |
recenterTimeout($milliseconds) |
Auto-recenter map after X ms of inactivity |
tileLayersUrl($layers) |
Set tile layer(s) |
markers($array) |
Set initial markers |
shapes($array) |
Set initial shapes |
geoJsonUrl($url) |
Set GeoJSON URL |
geoJsonData($data) |
Set GeoJSON density data |
geoJsonTooltip($tooltip) |
Set GeoJSON tooltip template |
pickMarker($marker) |
Customize the temporary marker shown on click |
onMapClick($callback) |
Handle map click events with closure callback |
onLayerClick($callback) |
Handle layer click events with closure callback |
handleMapClick($lat, $lng) |
Exposed Livewire method for map clicks |
handleLayerClick($layerId) |
Exposed Livewire method for layer clicks |
#MapEntry
| Method | Description |
|---|---|
make($name) |
Create a new MapEntry entry |
autoCenter(bool) |
Auto-center map to user's current location |
center($lat, $lng) |
Set map center coordinates |
zoom($level) |
Set initial zoom level |
height($pixels) |
Set map height |
mapDraggable($bool) |
Enable/disable map dragging |
mapZoomable($bool) |
Enable/disable map zooming |
static() |
Disable all map interactions (dragging & zooming) |
recenterTimeout($milliseconds) |
Auto-recenter map after X ms of inactivity |
tileLayersUrl($layers) |
Set tile layer(s) |
markers($array) |
Set initial markers |
shapes($array) |
Set initial shapes |
geoJsonUrl($url) |
Set GeoJSON URL |
geoJsonData($data) |
Set GeoJSON density data |
geoJsonTooltip($tooltip) |
Set GeoJSON tooltip template |
pickMarker($marker) |
Customize the temporary marker shown on click |
onMapClick($callback) |
Handle map click events with closure callback |
onLayerClick($callback) |
Handle layer click events with closure callback |
#MapColumn
| Method | Description |
|---|---|
make($name) |
Create a new MapColumn column |
autoCenter(bool) |
Auto-center map to user's current location |
center($lat, $lng) |
Set map center coordinates |
zoom($level) |
Set initial zoom level |
height($pixels) |
Set map height |
circular($value) |
Display map as circular container |
mapDraggable($bool) |
Enable/disable map dragging |
mapZoomable($bool) |
Enable/disable map zooming |
static() |
Disable all map interactions (dragging & zooming) |
recenterTimeout($milliseconds) |
Auto-recenter map after X ms of inactivity |
tileLayersUrl($layers) |
Set tile layer(s) |
markers($array) |
Set initial markers |
shapes($array) |
Set initial shapes |
geoJsonUrl($url) |
Set GeoJSON URL |
geoJsonData($data) |
Set GeoJSON density data |
geoJsonTooltip($tooltip) |
Set GeoJSON tooltip template |
pickMarker($marker) |
Customize the temporary marker shown on click |
onMapClick($callback) |
Handle map click events with closure callback |
onLayerClick($callback) |
Handle layer click events with closure callback |
#Marker
| Method | Description |
|---|---|
make($lat, $lng) |
Create a new marker |
fromRecord() |
Create marker from Eloquent model |
id($id) |
Set marker ID |
title($title) |
Set title (tooltip & popup) |
color($color) |
Set marker color |
icon($icon, $size) |
Set custom icon URL or Heroicon |
iconUrl($url) |
Set custom icon URL |
iconSize($size) |
Set icon size as [width, height] |
heroicon($icon) |
Set Heroicon (string or Heroicon enum) |
draggable($bool) |
Make marker draggable |
editable($bool) |
Make marker editable on the map |
group($group) |
Assign to group (string or BaseLayerGroup) |
popup($content, $fields, $options) |
Configure popup |
tooltip($content, $permanent, $direction, $options) |
Configure tooltip |
action($callback) |
Set click handler |
distanceTo($marker) |
Calculate distance to another marker |
validate() |
Validate coordinates |
#Shape (All Shapes)
| Method | Description |
|---|---|
color($color) |
Set border color |
fillColor($color) |
Set fill color |
weight($pixels) |
Set border width |
opacity($value) |
Set border opacity (0-1) |
fillOpacity($value) |
Set fill opacity (0-1) |
dashArray($pattern) |
Set dash pattern |
editable($bool) |
Make shape editable on the map |
popup($content, $fields, $options) |
Configure popup |
tooltip($content, $permanent, $direction, $options) |
Configure tooltip |
action($callback) |
Set click handler |
group($group) |
Assign to group (string or BaseLayerGroup) |
getCoordinates() |
Get center coordinates of the shape |
#Circle
| Method | Description |
|---|---|
make($lat, $lng) |
Create circle |
radius($meters) |
Set radius in meters |
radiusInMeters($meters) |
Set radius in meters |
radiusInKilometers($km) |
Set radius in kilometers |
radiusInMiles($miles) |
Set radius in miles |
radiusInFeet($feet) |
Set radius in feet |
#CircleMarker
| Method | Description |
|---|---|
make($lat, $lng) |
Create circle marker |
radius($pixels) |
Set radius in pixels |
#Polygon & Polyline
| Method | Description |
|---|---|
make($coordinates) |
Create with coordinates |
addPoint($lat, $lng) |
Add vertex/point |
#Polyline
| Method | Description |
|---|---|
smoothFactor($factor) |
Set line smoothing |
#Rectangle
| Method | Description |
|---|---|
make($corner1, $corner2) |
Create with corners |
makeFromCoordinates($lat1, $lng1, $lat2, $lng2) |
Create with coordinates |
#Layer Group (Base)
| Method | Description |
|---|---|
make($layers) |
Create layer group with layers |
id($id) |
Set group ID |
name($name) |
Set group name |
option($key, $value) |
Set a group option |
getLayers() |
Get all layers in the group |
#LayerGroup
| Method | Description |
|---|---|
make($layers) |
Create simple layer group |
name($name) |
Set user-visible group name |
id($id) |
Set group ID for controls |
editable($bool) |
Make all layers in group editable |
#FeatureGroup
| Method | Description |
|---|---|
make($markers) |
Create feature group from markers |
name($name) |
Set zone/area name |
blue(), red(), etc. |
Set border color |
fillBlue(), fillRed(), etc. |
Set fill color |
fillOpacity($value) |
Set fill transparency (0-1) |
weight($pixels) |
Set border width |
editable($bool) |
Make all layers in group editable |
#MarkerCluster
| Method | Description |
|---|---|
make($markers) |
Create cluster with markers |
fromModel() |
Create cluster from Eloquent model |
marker($marker) |
Add single marker |
markers($array) |
Add multiple markers |
name($name) |
Set cluster group name |
editable($bool) |
Make all markers in cluster editable |
maxClusterRadius($pixels) |
Set cluster radius (pixels) |
showCoverageOnHover($bool) |
Show cluster coverage on hover |
zoomToBoundsOnClick($bool) |
Zoom to bounds when clicked |
spiderfyOnMaxZoom($bool) |
Spread markers at max zoom |
disableClusteringAtZoom($level) |
Disable clustering at zoom level |
animate($bool) |
Animate cluster changes |
modifyQueryUsing($callback) |
Modify database query |
mapRecordUsing($callback) |
Customize each marker |
#Color Reference
Markers and shapes accept colors from multiple sources:
#Tile Layer Reference
Available tile layer providers:
TileLayer::OpenStreetMap- Free, open-source map tile providerTileLayer::GoogleStreets- Google Streets map layerTileLayer::GoogleSatellite- Google Satellite imagery layerTileLayer::GoogleHybrid- Google hybrid (streets + satellite) layerTileLayer::GoogleTerrain- Google terrain layerTileLayer::EsriWorldImagery- ESRI World Imagery layerTileLayer::EsriWorldStreetMap- ESRI World Street MapTileLayer::EsriNatGeo- ESRI National Geographic layerTileLayer::CartoPositron- Carto Positron light mapTileLayer::CartoDarkMatter- Carto Dark Matter mapTileLayer::Mapbox- Mapbox tiles (requires configured Access Token)
#Value Objects Reference
#Coordinate
The Coordinate value object represents a geographical point with latitude and longitude coordinates. It's used throughout the package for storing and manipulating map coordinates.
Storage Modes:
The Coordinate cast supports two storage modes:
- JSON Column - Store coordinates as JSON in a single column
- Virtual Attribute - Manage separate latitude and longitude columns automatically
Usage in Models - JSON Column:
use EduardoRibeiroDev\FilamentLeaflet\ValueObjects\Coordinate;

class Location extends Model
{
    protected $casts = [
        'coordinates' => Coordinate::class,  // Stores as { "lat": -23.5505, "lng": -46.6333 }
    ];
}

// Usage
$location = Location::first();
echo $location->coordinates->lat;  // -23.5505
echo $location->coordinates->lng;  // -46.6333
Usage in Models - Virtual Attribute (Separate Columns):
If you have separate latitude and longitude columns, use the cast with column parameters:
use EduardoRibeiroDev\FilamentLeaflet\ValueObjects\Coordinate;

class Store extends Model
{
    protected $casts = [
        // Maps to latitude and longitude columns
        'location' => Coordinate::class,
    ];
}

// Usage
$store = Store::first();
echo $store->location->lat;   // Reads from 'latitude' column
echo $store->location->lng;   // Reads from 'longitude' column
Practical Example - Virtual Attribute:
// Migration
Schema::create('stores', function (Blueprint $table) {
    $table->id();
    $table->string('name');
    $table->decimal('latitude', 10, 8);      // Stores lat
    $table->decimal('longitude', 11, 8);     // Stores lng
    $table->timestamps();
});

// Model
class Store extends Model
{
    protected $casts = [
        'location' => Coordinate::class . ':latitude,longitude', // If the lat/lng columns don't follow the config default names, specify them here
    ];
}
Basic Usage:
$store1 = Store::first();
$store2 = Store::find(2);

echo $store1->location->lat;  // Access latitude
echo $store1->location->lng;  // Access longitude

$distance = $store1->location->distanceTo($store2->location); // Calculate distance in kilometers
$store1->toArray(); // ['lat' => -23.5505, 'lng' => -46.6333]
$store1->toFlatArray(); // [-23.5505, -46.6333]

$store1->location = new Coordinate(-23.5505, -46.6333); // Update location
$store1->save();
Methods:
| Method | Description |
|---|---|
__construct($lat, $lng) |
Create a new Coordinate instance |
toArray() |
Convert to associative array with 'lat' and 'lng' keys |
toFlatArray() |
Convert to flat array [$lat, $lng] |
fromArray($array) |
Create from array with 'lat'/'lng' or numeric keys |
fromObject($object) |
Create from object with lat/lng properties |
from($coordinates) |
Universal factory method for arrays, objects, or Coordinate instances |
distanceTo($other) |
Calculate distance to another Coordinate (in kilometers) |
castUsing() |
Internal method for configuring Eloquent casting |
#GeoSearchResult
The GeoSearchResult value object represents a geocoding search result with complete location information from geocoding providers.
Properties:
$result->coordinate;   // Coordinate object with lat/lng
$result->name;         // Short place name (e.g., "São Paulo")
$result->displayName;  // Full formatted address
$result->type;         // Location type (building, street, city, etc.)
$result->addresstype;  // Address classification
$result->address;      // Address value object with detailed components
$result->boundingbox;  // Geographic bounds [minLat, minLng, maxLat, maxLng]
#Address
The Address value object contains structured address information from geocoding results.
Properties:
| Property | Type | Description |
|---|---|---|
suburb |
string|null | Suburb or neighborhood name |
cityDistrict |
string|null | City district |
city |
string|null | City name (town, village) |
county |
string|null | County name |
state |
string|null | State or province |
province |
string|null | Province name |
region |
string|null | Region name |
postcode |
string|null | Postal code |
country |
string|null | Country name |
countryCode |
string|null | ISO 3166-1 country code |
#Concern Methods Reference
#HasGeoJsonFile
| Method | Description |
|---|---|
getGeoJsonFileAttributeName() |
Returns the model attribute storing GeoJSON (default: 'geojson') |
getGeoJsonFileDisk() |
Returns the storage disk for the file (default: null = local) |
getExpirationTime() |
Returns DateTime for temporary URL expiration (default: null = permanent) |
getGeoJsonUrl() |
Returns the accessible URL for the GeoJSON file |
#Map Configuration Properties
These properties control core map behavior:
| Property | Type | Default | Description |
|---|---|---|---|
$mapCenter |
array | null | Initial map center [latitude, longitude] (null uses config default) |
$autoCenter |
bool | false | Auto-center to user's current location on load |
$defaultZoom |
int | 4 | Initial zoom level |
$mapHeight |
int | 598 | Map height in pixels |
$mapDraggable |
bool | true | Allow users to pan by dragging |
$mapZoomable |
bool | true | Allow users to zoom (scroll wheel, pinch) |
$recenterMapTimeout |
?int | null | Auto-recenter after X milliseconds of panning |
$maxZoom |
int | 19 | Maximum zoom level allowed |
$minZoom |
int | 2 | Minimum zoom level allowed |
$hasDrawMarkerControl |
bool | false | Show draw marker control |
$hasDrawCircleMarkerControl |
bool | false | Show draw circle marker toolbar |
$hasDrawCircleControl |
bool | false | Show draw circle toolbar |
$hasDrawPolylineControl |
bool | false | Show draw polyline toolbar |
$hasDrawRectangleControl |
bool | false | Show draw rectangle toolbar |
$hasDrawPolygonControl |
bool | false | Show draw polygon toolbar |
$hasDrawTextControl |
bool | false | Show draw text toolbar |
$hasEditLayersControl |
bool | false | Show edit layers toolbar |
$hasDragLayersControl |
bool | false | Show drag layers toolbar |
$hasRemoveLayersControl |
bool | false | Show remove layers toolbar |
$hasRotateLayersControl |
bool | false | Show rotate layers toolbar |
$hasCutPolygonControl |
bool | false | Show cut polygon toolbar |
$hasFullscreenControl |
bool | false | Show fullscreen button |
$hasSearchControl |
bool | false | Show address search |
$hasScaleControl |
bool | false | Show distance scale |
$hasZoomControl |
bool | true | Show zoom +/- buttons |
$hasAttributionControl |
bool | false | Show attribution text |
$tileLayersUrl |
mixed | OpenStreetMap | Base map tile layers |
#License
This package is open-sourced software licensed under the MIT license.
#Credits
- Built for Filament
- Uses Leaflet for mapping
- Created by Eduardo Ribeiro
#Support
For issues, questions, or contributions, please visit the GitHub repository. Don't forget, Jesus loves you ❤️.
Featured Plugins
A selection of plugins curated by the Filament team
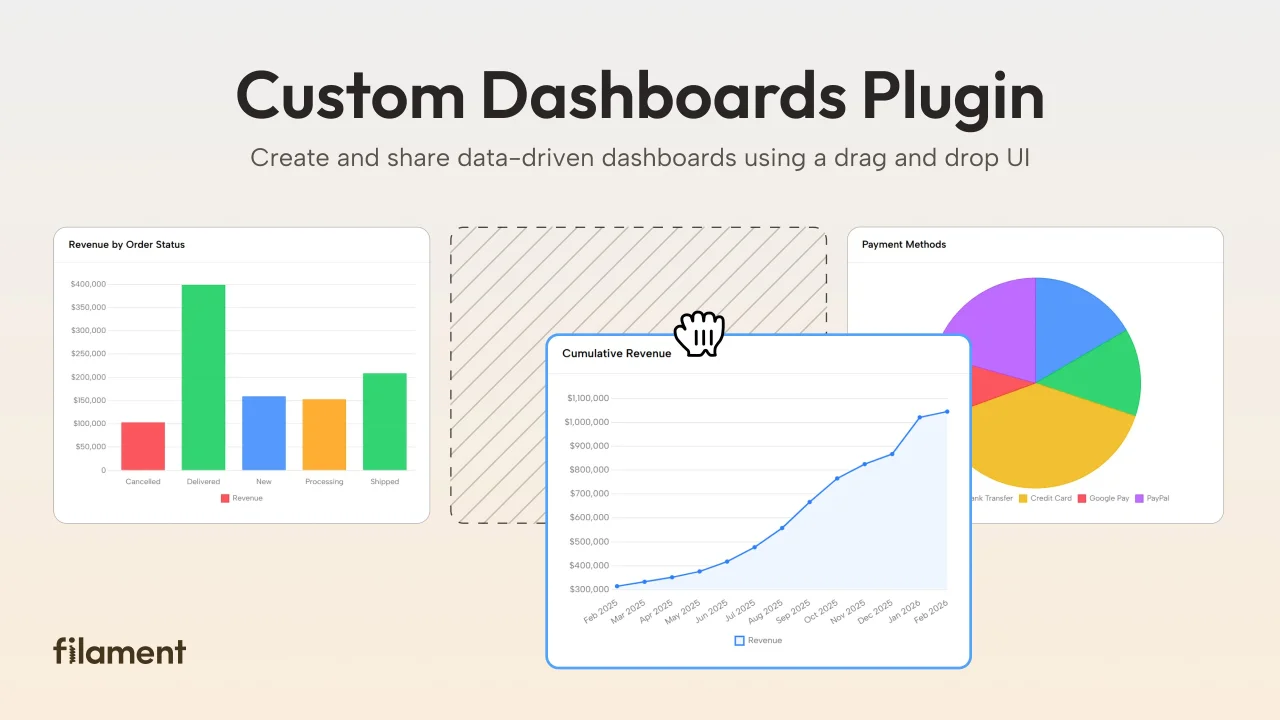
Custom Dashboards
Let your users build and share their own dashboards with a drag-and-drop interface. Define your data sources in PHP and let them do the rest.
 Filament

Spotlight Pro
Browse your Filament Panel with ease. Filament Spotlight Pro adds a Spotlight/Raycast like Command Palette to your Filament Panel.
 Dennis Koch
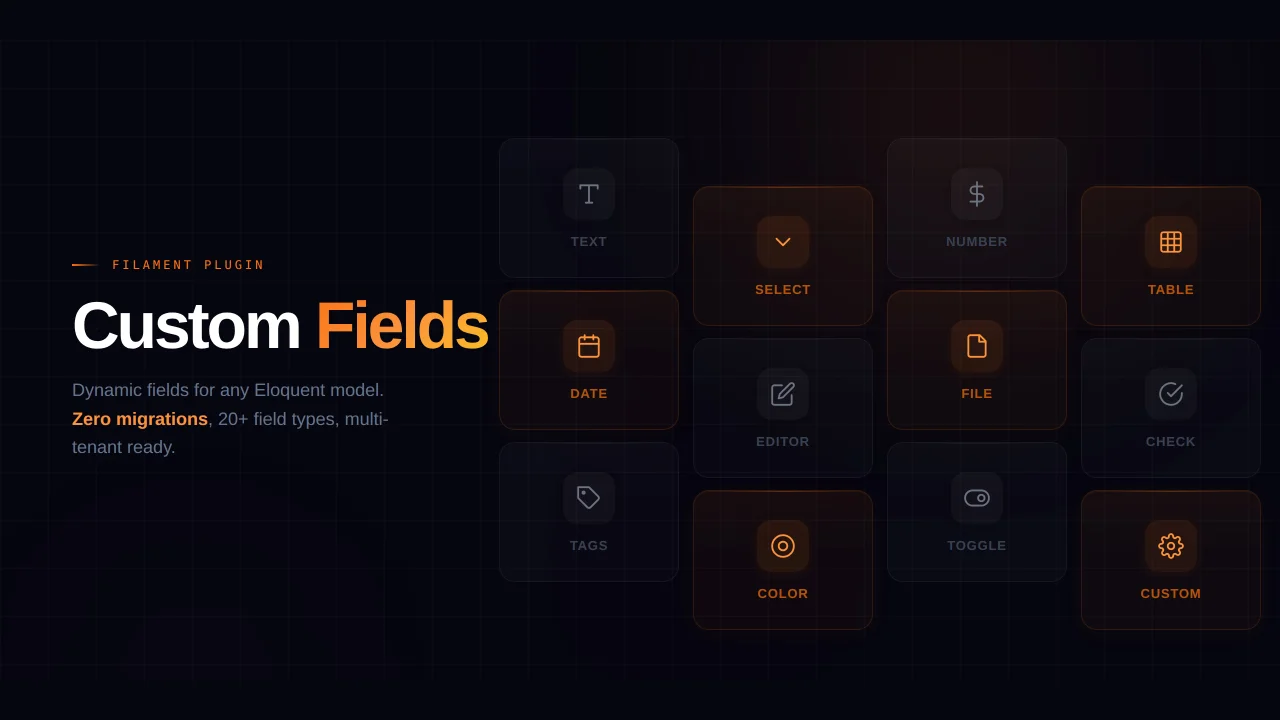
Custom Fields
Eliminate custom field migrations forever. Let your users create and manage form fields directly in Filament admin panels with 20+ built-in field types, validation, and zero database changes.
 Relaticle