Tricks

Aggregate data in table footer (sum, avg...etc)

Mar 31, 2023
moaaz faracheh
Admin panel, Table builder

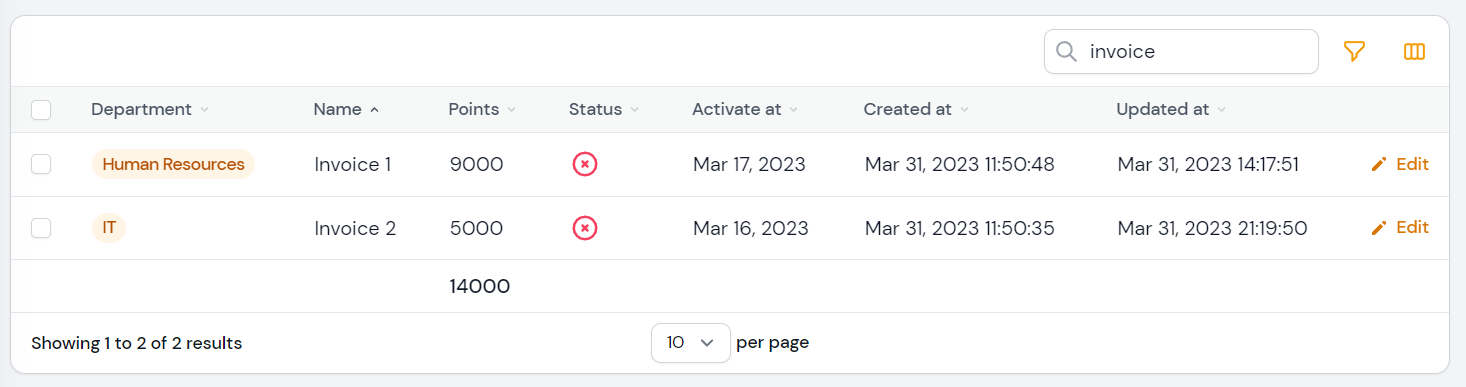
In many of the tables we use, we sometimes need to calculate the sum, average, maximum, minimum, or count for certain columns and display the data in the table footer.

To do so, we can use the getTableContentFooter() function and a custom view.

  1. Inside the resources > views directory, create a new directory called table.
  2. Create a new view and name it footer.
  3. Add the following code to the footer view. In this example, we use the sum function.
<x-tables::row>
<x-tables::cell>
{{-- for the checkbox column --}}
</x-tables::cell>
 
@foreach ($columns as $column)
<x-tables::cell
wire:loading.remove.delay
wire:target="{{ implode(',', \Filament\Tables\Table::LOADING_TARGETS) }}"
>
@for ($i = 0; $i < count($calc_columns); $i++ )
@if ($column->getName() == $calc_columns[$i])
<div class="filament-tables-column-wrapper">
<div class="filament-tables-text-column px-4 py-2 flex w-full justify-start text-start">
<div class="inline-flex items-center space-x-1 rtl:space-x-reverse">
<span class="font-medium">
{{ $records->sum($calc_columns[$i]) }}
</span>
</div>
</div>
</div>
@endif
@endfor
</x-tables::cell>
@endforeach
</x-tables::row>

Here, we loop through the columns and render a table cell for each one. If the column name matches one of the columns we want to aggregate, we calculate the sum.

  1. In the ListResourceExample page where you want to apply this footer (or in ExampleRelationManager if you wish to use it in relation table), add the following code to specify the columns to aggregate:
public array $data_list= [
'calc_columns' => [
'column1',
'column2',
],
];
  1. In the same page, call the getTableContentFooter() function and specify the view we just created and pass the columns we want to aggregate:
protected function getTableContentFooter(): ?View
{
return view('table.footer', $this->data_list);
}
avatar

Hi Moaaz Faracheh, Thanks for the neat tip. Here is a typo: {{ $records->sum($calc_columns[$I]) }}. Should be $i. greetings, martin

avatar

Hi Moaaz Faracheh, great trick! Thanks!

For my use case, I expanded your code to accept some parameters like format (money) and currency, as well as the case where the table does not have a checkbox column.

See:

 
protected function getTableContentFooter(): View
{
return view('tables.footer', [
'calc_columns' => [
[
'column' => 'monthly_fee_in_cents',
'operation' => 'sum',
'format'=> 'money',
'currency' => 'USD',
],
],
'hasCheckboxColumn' => false
]);
}
 
@php use Filament\Tables\Table; @endphp
 
<x-tables::row>
@if($hasCheckboxColumn)
<x-tables::cell>
{{-- for the checkbox column --}}
</x-tables::cell>
@endif
 
@foreach ($columns as $column)
<x-tables::cell
wire:loading.remove.delay
wire:target="{{ implode(',', Table::LOADING_TARGETS) }}"
>
@for ($i = 0; $i < count($calc_columns); $i++ )
@if ($column->getName() == $column = $calc_columns[$i]['column'])
@php
$operation = $calc_columns[$i]['operation'];
$money = $calc_columns[$i]['format'] ?? false;
$currency = $calc_columns[$i]['currency'] ?? 'USD';
@endphp
 
<div class="filament-tables-column-wrapper">
<div class="filament-tables-text-column px-4 py-2 flex w-full {{$money ? 'justify-end text-end' : 'justify-start text-start'}}">
<div class="inline-flex items-center space-x-1 rtl:space-x-reverse">
<span class="font-bold">
 
@if($money)
{{ money($records->$operation($column), $currency)->format() }}
@else
{{ $records->$operation($column) }}
@endif
</span>
</div>
</div>
</div>
@endif
@endfor
</x-tables::cell>
@endforeach
</x-tables::row>
avatar

Martin Mildner Thanks alot, I will correct it.

avatar

Sergio Jardim Thats really great thanks alot for the contribute.

👍 1
avatar

Hay moaaz faracheh Can we use that similar method to count peak values of widget charts ? Because I tried doing that it gives me an error.Ty

avatar

Hello Diksha, you cannot use this exact code for the widgets i will comment below how I can apporach such thing.

👍 1
avatar

This how approched it,

@php
$hasBulkAction = [false];
@endphp
@foreach($this->getCachedTableBulkActions() as $index => $action)
 
@php $hasBulkAction[] = $action->isAuthorized(); @endphp
@endforeach
 
<x-tables::row>
 
@if( in_array(true, $hasBulkAction) )
<x-tables::cell>
 
</x-tables::cell>
@endif


@foreach ($columns as $column)
<x-tables::cell
wire:loading.remove.delay
wire:target="{{ implode(',', \Filament\Tables\Table::LOADING_TARGETS) }}"
>
@for ($i = 0; $i < sizeof($calc_columns); $i++ )
 
 
@if ($column->getName() === $calc_columns[$i])
 
<div class="filament-tables-column-wrapper px-2">
<div class="filament-tables-text-column px-4 py-2 flex w-full justify-start text-start">
<div class="inline-flex items-center space-x-1 rtl:space-x-reverse">
<span class="font-medium">
{{ money($records->sum($calc_columns[$i]), convert: true) }}
</span>
</div>
</div>
</div>
@endif
@endfor
</x-tables::cell>
@endforeach
</x-tables::row>
avatar

Instead of {{$money ? 'justify-end text-end' : 'justify-start text-start'}} you could use: $columnClasses = match($column->getAlignment()) { 'center' => 'justify-center text-center', 'end' => 'justify-end text-end', 'left' => 'justify-start text-left', 'right' => 'justify-end text-right', 'justify' => 'justify-between text-justify', default => 'justify-start text-start', }; and {{ $columnClasses }}

avatar

For adding the aggregate functions to the widgets. Here I took the ordersChart function from the demo and made the modifications so you can apply it. In the widget you need to add such thing in the getHeading() function there is not footer as in tables. hope this helps.

 
<?php
 
namespace App\Filament\Widgets;
 
use Filament\Widgets\LineChartWidget;
 
class OrdersChart extends LineChartWidget
{
protected static ?string $heading = 'Orders per month';
 
protected static ?int $sort = 1;
 
public array $datasets =
[
'datasets' => [
[
'label' => 'Orders',
'data' => [2433, 3454, 4566, 2342, 5545, 5765, 6787, 8767, 7565, 8576, 9686, 8996],
],
],
'labels' => ['Jan', 'Feb', 'Mar', 'Apr', 'May', 'Jun', 'Jul', 'Aug', 'Sep', 'Oct', 'Nov', 'Dec'],
];
 
public string $myHeading = 'Orders per month';
 
protected function getHeading(): ?string
{
return $this->myHeading;
}
 
protected function getData(): array
{
$sum = array_sum($this->datasets['datasets'][0]['data']);
$this->myHeading = 'Orders per month ( Sum: ' . $sum . ')';
 
return $this->datasets;
}
 
}
🥳 1
avatar

@Diksha

👍 1
avatar

@moaazfaracheh - Thank-you so much but just wanna know one more thing, Can I do this using map function ? I want to calculate Total number or sum of Peaks using line graph chart. Right now I setup the data array and Declare number of peaks variable and set it to zero & Loop through each element of the data array and add the value to the total and then I set the message property & Return the data for the chart . But using this in return datasets' => [ [ 'label' => 'Test Data By Month', 'data' => $data, ], ], 'labels' => ['Jan', 'Feb', 'Mar', 'Apr', 'May', 'Jun', 'Jul', 'Aug', 'Sep', 'Oct', 'Nov', 'Dec'], ]; CAN I DO THE ABOVE WITH THIS DATASET? -> 'datasets' => [ [ 'label' => 'Prospects', 'data' => $data->map(fn (TrendValue $value) => $value->aggregate), ], ], 'labels' => $data->map(fn (TrendValue $value) => $value->date), ];

avatar

most welcome, one thing I am not getting where are you trying to get the $data from ? is it just one table in the database?

👍 1
avatar

yes @moaazfaracheh

avatar

public $message = '';

protected function getData(): array
{
// Set up the data array
$data = [0, 10, 5, 2, 21, 32, 45, 74, 65, 45, 77, 89];
 
// Declare number of peaks variable and set it to zero
$numPeaks = 0;
 
// Loop through each element of the data array and add the value to the total
foreach ($data as $peak) {
$numPeaks = $numPeaks + $peak;
}
 
// Set the message property
$this->message = "Total number of peaks: $numPeaks";


// Return the data for the chart
return [
'datasets' => [
[
'label' => 'Test Data By Month',
'data' => $data,
],
],
'labels' => ['Jan', 'Feb', 'Mar', 'Apr', 'May', 'Jun', 'Jul', 'Aug', 'Sep', 'Oct', 'Nov', 'Dec'],
];
}

} This is the code I used.

avatar

@moaazfaracheh But I want It to be done using this return [ 'datasets' => [ [ 'label' => 'Prospects', 'data' => $data->map(fn (TrendValue $value) => $value->aggregate), ], ], 'labels' => $data->map(fn (TrendValue $value) => $value->date), ]; }

avatar

Hi again Diksha I hope this code is your approach (make sure to install the flowframe/laravel-trend package)

change the Order::class to the model you wish to use. the total_price is the column name i want to get the sum for. in the Order::class i have created_at column also which is used here to give the correct data.

<?php
 
namespace App\Filament\Widgets;
 
use App\Models\Shop\Order;
use Filament\Widgets\LineChartWidget;
use Flowframe\Trend\Trend;
use Flowframe\Trend\TrendValue;
 
class OrdersChart extends LineChartWidget
{
protected static ?string $heading = 'Orders per month';
 
protected static ?int $sort = 1;
 
public string $myHeading = 'Orders per month';
 
protected function getHeading(): ?string
{
return $this->myHeading;
}
 
protected function getData(): array
{
$data = Trend::model(Order::class)
->between(
start: now()->startOfYear(),
end: now(),
)
->perMonth()
->sum('total_price');
 
$datasets =
[
'datasets' => [
[
'label' => 'Orders',
'data' => $data->map(fn (TrendValue $value) => $value->aggregate),
],
],
'labels' => $data->map(fn (TrendValue $value) => $value->date),
];
 
$sum = $data->map(fn (TrendValue $value) => $value->aggregate)->sum();
$this->myHeading = 'Orders per month (Sum: ' . $sum . ')';
 
return $datasets;
}
 
}

documentation.

https://filamentphp.com/docs/2.x/admin/dashboard/charts#generating-chart-data-from-an-eloquent-model

👍 1
avatar

@moaazfaracheh than-you so much :)

avatar

Can i use this on a table widget? Thanks moaaz faracheh

avatar

Hello Garadiit, the trick is for using aggregate in the footer. but you can check my last comment where it has code, it's for widgets. let me know if it help.

avatar

What would it take to use a calculated field? I wrote a Discord question with some detail (https://discord.com/channels/883083792112300104/1131256536656773172)

Tables\Columns\TextColumn::make('id') ->getStateUsing(function(Schedule $record) { return $record->id; }), Tables\Columns\TextColumn::make('id_test') ->getStateUsing(function(Schedule $record) { return $record->id; }),

Cannot paste image..

Nice trick!

avatar

How can i find count the working_day ( date ) column ?

avatar

im getting SUM() of first 10 item of pagination

👀 1
avatar

I've modified the code a little. Now it counts all records without depending on the page.

private array $calcColumns = [
'visits',
'users',
];
 
protected function getTableContentFooter(): ?View
{
$query = $this->getFilteredTableQuery();
$sql = [];
foreach ($this->calcColumns as $column) {
$sql[] = 'SUM("' . $column . '") as ' . $column;
}
$query->select(DB::raw(implode(', ', $sql)));
$total = $query->get()->toArray()[0] ?? [];
 
return view('filament.tables.table-summary', ['calcColumns' => $this->calcColumns, 'modelTotal' => $total]);
}

And view

 
<x-tables::row>
<x-tables::cell>
{{-- for the checkbox column --}}
</x-tables::cell>
 
@foreach ($columns as $column)
<x-tables::cell
wire:loading.remove.delay
wire:target="{{ implode(',', \Filament\Tables\Table::LOADING_TARGETS) }}"
>
@for ($i = 0; $i < count($calcColumns); $i++ )
@if ($column->getName() == $calcColumns[$i])
<div class="filament-tables-column-wrapper">
<div class="filament-tables-text-column px-4 py-2 flex w-full justify-start text-start">
<div class="inline-flex items-center space-x-1 rtl:space-x-reverse">
<span class="font-medium">
{{ $modelTotal[$column->getName()] ?? 0 }}
</span>
</div>
</div>
</div>
@endif
@endfor
</x-tables::cell>
@endforeach
</x-tables::row>